在Titanium中如何画图表
目前版本的Titanium的一个弱点就是不能画图!这回我们说说通过
flot在Titanium中画图表。
flot的下载
flot的主页: http://code.google.com/p/flot/
下载flot-0.7.zip后,把以下文件拷贝到自己的工程中:
flot的测试
作成以下flot测试用的plot_window.js:
其中WebView中表示的plot.html文件如下:
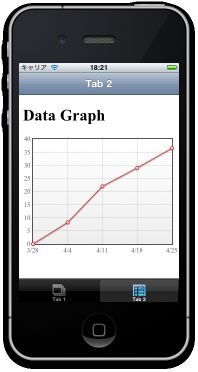
运行之后看看效果图:
在TableView中表示图表
修改plot_window.js
运行之后,按下TableView左上角的Graph按钮后,看看效果图:

flot的下载
flot的主页: http://code.google.com/p/flot/
下载flot-0.7.zip后,把以下文件拷贝到自己的工程中:
- jquery.flot.js
- jquery.js
flot的测试
作成以下flot测试用的plot_window.js:
var win = Ti.UI.currentWindow;

var webView = Ti.UI.createWebView({
	url: 'plot.html'
});
win.add(webView);
其中WebView中表示的plot.html文件如下:
<!DOCTYPE HTML PUBLIC "-//W3C//DTD HTML 4.01 Transitional//EN" "http://www.w3.org/TR/html4/loose.dtd">
<html>
 <head>
    <meta http-equiv="Content-Type" content="text/html; charset=utf-8">
    <title>Flot Examples</title>
    <link href="layout.css" rel="stylesheet" type="text/css">
    <!--[if lte IE 8]><script language="javascript" type="text/javascript" src="../excanvas.min.js"></script><![endif]-->
    <script language="javascript" type="text/javascript" src="jquery.js"></script>
    <script language="javascript" type="text/javascript" src="jquery.flot.js"></script>
 </head>
    <body>
    <h1>Data Graph</h1>

    <div id="graph" style="width:310px;height:240px;"></div>

	<script type="text/javascript">
	var weights = [[1301270400000,0],[1301875200000,8.25],[1302480000000,22],[1303084800000,29],[1303689600000,36.5]];
	var ticks = [1301270400000,1301875200000,1302480000000,1303084800000,1303689600000];
	var setting = {
	        series: {
	            lines: { show:true},
	            points: { show:true}
	        },
	        xaxis: {
	            mode:"time",
	            timeformat:"%m/%d",
	            tickSize: [7,"day"],
	            ticks: ticks
	        },
	        yaxis: {
	            ticks: 10,
	            min: 0,
	        },
	        grid: {
	            backgroundColor: { colors: ["#fff","#eee"] },
	        }
	   };
	$.plot($("#graph"),[{data: weights, color: 2}], setting);
	</script>

 </body>
</html>
运行之后看看效果图:
在TableView中表示图表
var graphButton = Ti.UI.createButton({title: 'Graph'});
graphButton.addEventListener(
'click', function () {
	if (records.length > 0) {
		var weights = "[";
		var ticks = "[";
		for (i = records.length-1; i >= 0; i--) {
			weights = weights + "[" + records[i].at.getTime() +","+records[i].weight+"],";
			ticks = ticks + records[i].at.getTime() + ",";
		}
		weights = weights + "]"; ticks = ticks + "]";
		var graphWindow = Ti.UI.createWindow({
			url: 'plot_window.js',
			weights: weights,
			ticks: ticks
		}
		);
		Ti.UI.currentTab.open(graphWindow);
	}
}
);
win.leftNavButton = graphButton;
修改plot_window.js
webView.addEventListener('load', function(){
	webView.evalJS('weights =' + win.weights + ';');
	webView.evalJS('ticks =' +  win.ticks + ';');
	webView.evalJS('setting.xaxis.ticks = ticks;');
	webView.evalJS('$.plot($("#graph"),[{data: weights, color: 2}], setting);');
});
运行之后,按下TableView左上角的Graph按钮后,看看效果图: