使用Jfreechart实现带热点的饼状图
JFreeChart是JAVA平台上的一个开放的图表绘制类库。它完全使用JAVA语言编写,是为applications, applets, servlets 以及JSP等使用所设计。JFreeChart可生成饼图(pie charts)、柱状图(bar charts)、散点图(scatter plots)、时序图(time series)、甘特图 (Gantt charts)等等多种图表,并且可以产生PNG和JPEG格式 的输出,还可以与PDF和EXCEL关联。
JFreeChart目前是最好的java图形解决方案,基本能够解决目前的图形方面的需求。
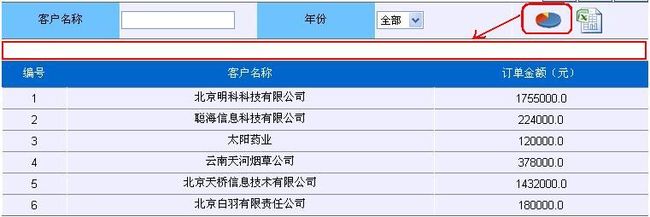
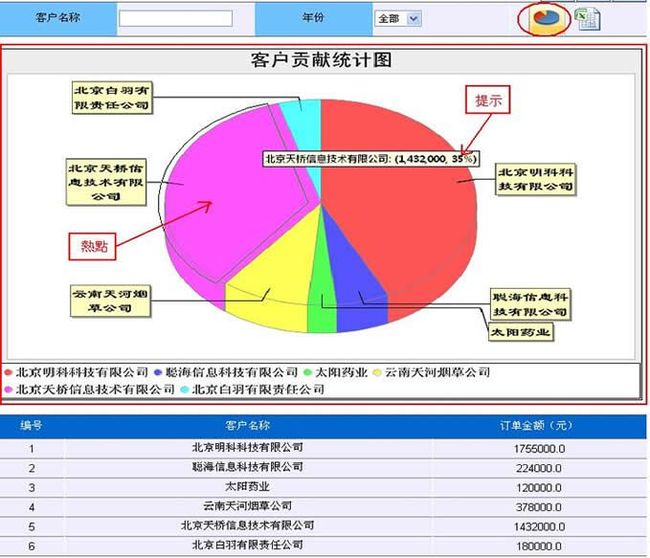
今天给大家介绍一下如何在一个頁面中嵌入一个带热点的饼状图.如下图所示:
完整范例如下:
1. 在SSH框架中添加Jfreechart 所依賴的Jar包:jfreechart-1.0.9.jar和 jcommon-1.0.12.jar
2. 在Action 創建一個餅狀圖的DataSet對象,用來保存從數據庫讀取的數據.
package com.crms.web.dwr;

import java.util.List;

import org.jfree.data.general.DefaultPieDataset;
import com.crms.biz.StatisticsBiz;
import com.crms.pojo.Customerinfo;
import com.crms.pojo.msms.Orderdetail;
import com.crms.pojo.msms.Orders;
import com.opensymphony.xwork2.ActionSupport;

/**
 * 统计报表模块
 *
 * @author Liyongbin
 * @date 2010-01-15
 *
 */

public class StatisticsAction extends ActionSupport {

	private static final long serialVersionUID = -9195275764281964720L;
	private StatisticsBiz statisticsBiz;
	private List<Orderdetail> orderdetailList;
	private Customerinfo customerinfo;
	// 饼状图数据对象
	private DefaultPieDataset pieDataSet = new DefaultPieDataset();


	public StatisticsBiz getStatisticsBiz() {
		return statisticsBiz;
	}

	public void setStatisticsBiz(StatisticsBiz statisticsBiz) {
		this.statisticsBiz = statisticsBiz;
	}

	public List<Orderdetail> getOrderdetailList() {
		return orderdetailList;
	}

	public void setOrderdetailList(List<Orderdetail> orderdetailList) {
		this.orderdetailList = orderdetailList;
	}

	public Customerinfo getCustomerinfo() {
		return customerinfo;
	}

	public void setCustomerinfo(Customerinfo customerinfo) {
		this.customerinfo = customerinfo;
	}

	public DefaultPieDataset getPieDataSet() {
		return pieDataSet;
	}

	public void setPieDataSet(DefaultPieDataset pieDataSet) {
		this.pieDataSet = pieDataSet;
	}

	/**
	 * 贡献分析--查询所有记录
	 */
	public String queryOfferUp() {
		/**
		 * 1.由从msms数据中查询到的用户ID, 2.再由用户ID从crms数据库获取用户的名称 3.将用户称显示在JSP中
		 */
		String customerId = null;
		try {
			// 1.由从msms数据中查询到的用户ID
			orderdetailList = statisticsBiz.getOrderdetailService().queryAll();
			// 设置迭代因子
			Integer i = 0;
			// 将所有的用户ID(String),迭代替换成用户名称(String)
			for (Orderdetail orderdetail_2 : orderdetailList) {
				customerId = ((Orders) (orderdetail_2.getOrders()))
						.getCustomer_id();
				// 得到用户的名称
				customerinfo = statisticsBiz.getCustomerinfoService()
						.queryById(customerId);
				// 迭代替换
				((Orders) (orderdetailList.get(i).getOrders()))
						.setCustomer_id(customerinfo.getCustomerName());
				// 给JFreeChart传数据
				pieDataSet.setValue(customerinfo.getCustomerName(), orderdetail_2
						.getSub_price());
				i++;
			}
			// 传给JSP页面
			//request_1.put("dataSet", dataSet);
		} catch (Exception e) {
			e.printStackTrace();
		}
		return "success";
	}

	@Override
	public String execute() throws Exception {
		return super.execute();
	}

	/**
	 * 用于超链接
	 *
	 * @return
	 */
	public String success() {
		return "success";
	}

}
3. 配置struts.xml文件
<?xml version="1.0" encoding="UTF-8"?>
<!DOCTYPE struts PUBLIC
	"-//Apache Software Foundation//DTD Struts Configuration 2.1//EN"
	"http://struts.apache.org/dtds/struts-2.1.dtd">
<struts>
	<!-- 拦截struts的扩展名  -->
	<constant name="struts.action.extension" value="action,"/>
	<!-- 开发模式  -->
	<constant name="struts.devModel" value="true"/>
value="crms"/>
	<package name="statistics" namespace="/statistics" extends="jfreechart-default">
		<action name="userinfo" class="userinfoAction">

			<result name="success">
				/WEB-INF/jsp/index.jsp
			</result>
			<result name="error">
				/login.jsp
			</result>
		</action>

		<action name="link_*" class="statisticsAction">
			<result name="success">
				/WEB-INF/jsp/statisticsReport/{1}.jsp
			</result>
		</action>

	</package>
</struts>
4. 寫JSP頁面offerUp.jsp
<%@ page language="java" import="java.util.*" pageEncoding="UTF-8"%>
<%@ taglib uri="/struts-tags" prefix="s"%>
<%@page import="org.jfree.data.general.DefaultPieDataset"%>
<%@page import="org.jfree.chart.plot.PiePlot3D"%>
<%@page import="java.awt.Font"%>
<%@page import="org.jfree.chart.title.LegendTitle"%>
<%@page import="org.jfree.chart.title.TextTitle"%>
<%@page import="org.jfree.chart.JFreeChart"%>
<%@page import="org.jfree.chart.labels.StandardPieToolTipGenerator"%>
<%@page import="org.jfree.chart.imagemap.StandardURLTagFragmentGenerator"%>
<%@page import="org.jfree.chart.urls.StandardPieURLGenerator"%>
<%@page import="org.jfree.chart.entity.StandardEntityCollection"%>
<%@page import="org.jfree.chart.ChartRenderingInfo"%>
<%@page import="java.io.PrintWriter"%>
<%@page import="org.jfree.chart.servlet.ServletUtilities"%>
<%@page import="org.jfree.chart.ChartUtilities"%>
<%
String path = request.getContextPath();
String basePath = request.getScheme() + "://"
+ request.getServerName() + ":" + request.getServerPort()
+ path + "/";
%>
<%--分析贡献 --%>
<!DOCTYPE HTML PUBLIC "-//W3C//DTD HTML 4.01 Transitional//EN">
<html>
<head>
<base href="<%=basePath%>">
<title>createDictionary</title>
<meta http-equiv="pragma" content="no-cache">
<meta http-equiv="cache-control" content="no-cache">
<meta http-equiv="expires" content="0">
<meta http-equiv="keywords" content="keyword1,keyword2,keyword3">
<meta http-equiv="description" content="This is my page">
<link href="jsp/../css/style.css" type="text/css" rel="stylesheet">
<style type="text/css">
.btnStyle {
border: #2C59AA 1px solid;
padding: 3px 2px 0px 5px;
margin-left: 2px;
width: 40px;
height: 20px;
FILTER: progid : DXImageTransform.Microsoft.Gradient (
GradientType =
0, StartColorStr = #ffffff, EndColorStr =
#C3DAF5 );
cursor: hand;
}
#btnSave,#btnReturn,#btnHelp {
float: left;
}
#button {
float: right;
}
#operate div,th,tr td {
font-size: 13px;
}
#condition {
clear: both;
}
.statisticsIcon {
background: url(images/statistics_report.png) no-repeat;
margin-left: 10px;
width: 43px;
height: 40px;
}
/*饼状图*/
.caky {
background-position: -88px -2px;
}
.caky_over {
background-position: -88px -105px;
}
#showJfreechart,jfreechart{
float:left;
}
#statisticsReport{
height:10px;
}
/*导出office*/
.exportIcon{
background: url(images/office.gif) no-repeat;
margin-left: 5px;
width: 43px;
height: 40px;
}
.export2Excel{
background-position: -2px -2px;
}
.export2Excel_over{
background-position: -2px -78px;
}
#exportSheet,#showJfreechart{
float:left;
cursor:hand;
}
</style>
<script type="text/javascript" src="js/jquery-1.3.2.js"></script>
<script type="text/javascript">
$(document).ready(function(){
//统计图图标的响应事件
$("#showJfreechart").bind("click",function(){
var $content = $('#jfreechart');
if($content.is(":visible")){
$content.hide(1000);
}else{
$content.show(1000);
}
})
//鼠标经过统计图标按钮 //鼠标离开按钮
$("#showJfreechart").hover(function(){
$(this).addClass("caky_over");
},function(){
$(this).removeClass("caky_over");
})
//导出Excel图标的响应事件
$("#exportSheet").bind("click",function(){
window.location.href="excel_offerUp";
})
//鼠标经过导出Excel图标按钮 //鼠标离开按钮
$("#exportSheet").hover(function(){
$(this).addClass("export2Excel_over");
},function(){
$(this).removeClass("export2Excel_over");
})
});
</script>
</head>
<body>
<div id="page">
<div id="operate">
<div id="position">
数据统计 >>
<strong>分析客户贡献</strong>
</div>
<div id="button">
<div id="btnSave" class="btnStyle">
保存
</div>
<div id="btnReturn" class="btnStyle">
返回
</div>
<div id="btnHelp" class="btnStyle">
帮助
</div>
</div>
</div>
<div id="form">
<table class="query_form_table">
<tr>
<th>客户名称</th>
<td><input /></td>
<th>年份</th>
<td>
<select>
<option>全部</option>
<option>2005</option>
<option>2006</option>
<option>2007</option>
<option>2008</option>
<option>2009</option>
<option>2010</option>
</select>
</td>
<td>
<div class="statisticsIcon caky" id="showJfreechart">
</div>
<div class="exportIcon export2Excel" id="exportSheet">
</div>
</td>
</tr>
</table>
<div id="statisticsReport">
<div id="jfreechart" style="display: none;">
<br/>
<%
//创建所需的数据
DefaultPieDataset data = new DefaultPieDataset();
data=(DefaultPieDataset)request.getAttribute("pieDataSet");
//创建3D饼状图的Plot对象
PiePlot3D plot = new PiePlot3D(data);
plot.setLabelFont(new Font("隶书", Font.BOLD, 16));
//生成图表
JFreeChart chart = new JFreeChart("",
JFreeChart.DEFAULT_TITLE_FONT, plot, true);
//标题
chart.setTitle(new TextTitle("客户贡献统计图", new Font("黑体", Font.BOLD,
22)));
//图例
LegendTitle legend = chart.getLegend(0);
legend.setItemFont(new Font("宋体", Font.BOLD, 14));
//生成提示
plot.setToolTipGenerator(new StandardPieToolTipGenerator());
//设置热点链接
plot.setURLGenerator(new StandardPieURLGenerator("statistics/link_offerUpDetail!success"));
//
StandardEntityCollection entityCollection = new StandardEntityCollection();
//将图片放在临时目录下
ChartRenderingInfo info = new ChartRenderingInfo(entityCollection);
PrintWriter pw = new PrintWriter(out);
//720是图片长度,450是图片高度
String filename = ServletUtilities.saveChartAsPNG(chart,720,450,info,session);
ChartUtilities.writeImageMap(pw, "map0", info, false);
//
String url = basePath+ "/servlet/DisplayChart?filename=" + filename;//request.getContextPath()
pw.flush();
%>
<img src="<%=url%>" alt="<%=url%>" width="750" height="450" usemap="#map0" border="1" />
</div>
</div>
</div>
<div id="list">
<br />
<table class="data_list_table">
<tr>
<th>编号</th>
<th>客户名称</th>
<th>订单金额(元)</th>
</tr>
<!-- 读取数据库开始 -->
<s:iterator value="#request.orderdetailList" id="orderdetail" status="i">
<tr>
<td class="list_data_text"><s:property value="#i.index+1"/></td>
<td class="list_data_text"><s:property value="#orderdetail.orders.customer_id"/></td>
<td class="list_data_text"><s:property value="#orderdetail.sub_price"/></td>
</tr>
</s:iterator>
<!-- 读取数据库结束 -->
</table>
</div>
</div>
</body>
</html>
5. 配置web.xml文件
<?xml version="1.0" encoding="UTF-8"?>
<web-app version="2.5" xmlns="http://java.sun.com/xml/ns/javaee"
	xmlns:xsi="http://www.w3.org/2001/XMLSchema-instance"
	xsi:schemaLocation="http://java.sun.com/xml/ns/javaee
	http://java.sun.com/xml/ns/javaee/web-app_2_5.xsd">

<!-- 显示JFreeChart-->
	<servlet>
		<servlet-name>DisplayChart</servlet-name>
		<servlet-class>org.jfree.chart.servlet.DisplayChart</servlet-class>
	</servlet>
	<servlet-mapping>
		<servlet-name>DisplayChart</servlet-name>
		<url-pattern>/servlet/DisplayChart</url-pattern>
	</servlet-mapping>

        <filter>
		<filter-name>struts2</filter-name>
		<filter-class>org.apache.struts2.dispatcher.ng.filter.StrutsPrepareAndExecuteFilter
                </filter-class>
	</filter>
	<!-- Struts2框架所拦截的文件后缀配置begin-->
	<filter-mapping>
		<filter-name>struts2</filter-name>
		<url-pattern>/statistics/*</url-pattern>
	</filter-mapping>

</web-app>
6. 最后運行的結果如下圖所示:
