weka(一) 分类. weka预测新浪微博有效用户
下载和安装就不说了
参考文档:
1. Use Weka in your Java code ==> http://weka.wikispaces.com/Use+Weka+in+your+Java+code#Examples
2. 图形化界面使用步骤 ==> http://www2.tech.purdue.edu/cit/Courses/CIT499d/
3. Weka使用笔记 ==> http://hi.baidu.com/luowenhan2008/blog/item/e9e37f19f20093a14bedbce8.html
4. weka软件中bayes分类器的使用==> http://hi.baidu.com/%CF%FE%D4%C2%B7%C9%B7%C9/blog/item/d3062c1eab3ae869f624e4e4.html
中文乱码解决:将安装文件夹内的RunWeka.ini文件打开,将fileEncoding的值Cp1252换成Cp936
1. txt文件转化为arff文件:
一、Weka使用:
1. 启动Weka-3-6/Weka 3.6,打开窗口Weka GUI Chooser如下
2. 点击Explorer按钮后出现如下窗口
--Preprocess选项卡:
(1)Open file ,浏览到.artff文件(我抓取的用户信息,经过人工识别有效用户)
(2)Class: 有效用户(Nom) ,表示统计的变量是“有效用户”这一个属性
Visualize All ,可以观察到的每张柱状图 是“某个属性的划分的个数统计”;蓝色 表示有效用户,红色 表示无效用户。
--Classify选项卡:
(1)Classifier/Choose 按钮可以选择分类“方法”
(2)Test options
Percentage split %80 ,表示.artff文件中前80%为训练集 ,后%20为测试集
(Nom)有效用户 ,表示NaiveBayes分类中的“类别”是属性“有效用户”的几个划分(∈{y,n})
点击 Start按钮 就开始按照上面的设置“将.artff文件前80%作为训练集构造NaiveBayes分类器,然后将20%作为测试集评估分类器”
实验结果如下:
=== Run information ===

Scheme:weka.classifiers.bayes.NaiveBayes
Relation:     weibo.users
Instances:    50
Attributes:   22
              粉丝数
              关注数
              互粉数
              证券
              股市
              股票
              分析师
              华尔街
              投资
              期货
              金融
              财经
              交易
              基金
              理财
              资金
              财富
              钱
              性别
              认证用户
              地点
              有效用户
Test mode:split 80.0% train, remainder test

=== Classifier model (full training set) ===

Naive Bayes Classifier

                Class
Attribute           y      n
               (0.31) (0.69)
=============================
粉丝数
  <1000            6.0   29.0
  <10000          10.0    6.0
  >=10000          2.0    3.0
  [total]         18.0   38.0

关注数
  <50              1.0    5.0
  <100             3.0    6.0
  <200             4.0    8.0
  <300             2.0    5.0
  <500             2.0    6.0
  <1000            6.0    9.0
  >=1000           4.0    3.0
  [total]         22.0   42.0

互粉数
  <50              4.0   17.0
  <100             4.0    6.0
  <150             3.0    6.0
  <200             2.0    4.0
  <300             3.0    2.0
  <500             2.0    5.0
  <1000            4.0    1.0
  >=1000           1.0    2.0
  [total]         23.0   43.0

证券
  证券               2.0    1.0
  其他              15.0   36.0
  [total]         17.0   37.0

股市
  股市               1.0    1.0
  其他              16.0   36.0
  [total]         17.0   37.0

股票
  股票               1.0    1.0
  其他              16.0   36.0
  [total]         17.0   37.0

分析师
  分析师              5.0    1.0
  其他              12.0   36.0
  [total]         17.0   37.0

华尔街
  华尔街              1.0    1.0
  其他              16.0   36.0
  [total]         17.0   37.0

投资
  投资               4.0    3.0
  其他              13.0   34.0
  [total]         17.0   37.0

期货
  期货               7.0    6.0
  其他              10.0   31.0
  [total]         17.0   37.0

金融
  金融               3.0    2.0
  其他              14.0   35.0
  [total]         17.0   37.0

财经
  财经               3.0    1.0
  其他              14.0   36.0
  [total]         17.0   37.0

交易
  交易               3.0    4.0
  其他              14.0   33.0
  [total]         17.0   37.0

基金
  基金               1.0    1.0
  其他              16.0   36.0
  [total]         17.0   37.0

理财
  理财               2.0    2.0
  其他              15.0   35.0
  [total]         17.0   37.0

资金
  资金               2.0    1.0
  其他              15.0   36.0
  [total]         17.0   37.0

财富
  财富               2.0    1.0
  其他              15.0   36.0
  [total]         17.0   37.0

钱
  钱                1.0    1.0
  其他              16.0   36.0
  [total]         17.0   37.0

性别
  m               13.0   25.0
  f                4.0   12.0
  其他               1.0    1.0
  [total]         18.0   38.0

认证用户
  上海               4.0    7.0
  北京               5.0    7.0
  香港               1.0    2.0
  广州               4.0    9.0
  杭州               1.0    1.0
  其他               6.0   15.0
  [total]         21.0   41.0

地点
  其他              16.0   36.0
  [total]         16.0   36.0


Time taken to build model: 0 seconds

=== Evaluation on test split ===
=== Summary ===

Correctly Classified Instances           6               60      %
Incorrectly Classified Instances         4               40      %
Kappa statistic                          0.2
Mean absolute error                      0.3518
Root mean squared error                  0.54
Relative absolute error                 70.352  %
Root relative squared error             97.5101 %
Total Number of Instances               10

=== Detailed Accuracy By Class ===

               TP Rate   FP Rate   Precision   Recall  F-Measure   ROC Area  Class
                 0.4       0.2        0.667     0.4       0.5        0.88     y
                 0.8       0.6        0.571     0.8       0.667      0.88     n
Weighted Avg.    0.6       0.4        0.619     0.6       0.583      0.88

=== Confusion Matrix ===

 a b   <-- classified as
 2 3 | a = y
 1 4 | b = n
二、实验过程略(见/eclipse-tonysu/weibo4j-oauth2工程)
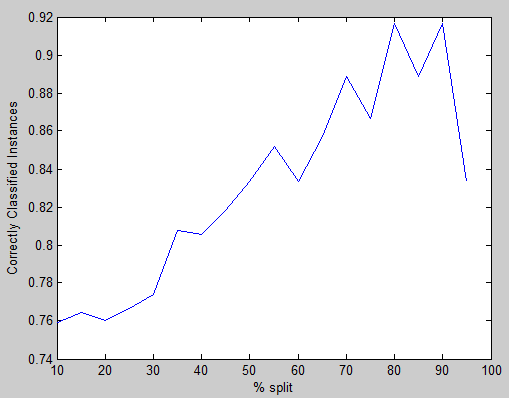
实验结果——120组采样时,下面分别是“训练集的%”和“测试集正确分类率”:
x=[10,15,20,25,30,35,40,45,50,55,60,65,70,75,80,85,90,95]
y=[0.759259,0.764706,0.760417,0.766667,0.77381,0.807692,0.805556,0.818182,0.833333,0.851852,0.833333,0.857143,0.888889,0.866667,0.916667,0.888889,0.916667,0.833333]
plot(x,y)
xlabel('% split')
ylabel('Correctly Classified Instances')
Matlab作图
解释:
1. 训练集越多,正确分类率越高
2. 随着训练集占的比例升高,测试集比例下降,因此测试集的随机性增加,图形变得不稳定
类比“入侵检测”中:降低误报率,降低漏报率。两者是矛盾的,如何权衡
注:写一个文件编码转换器 i.e. gbk->utf-8
