最近在用Open Flash Chart做报表,在网上查了很多关于Open Flash Chart2的资料,可惜的是中文资料很少。现在自己开始开发基于Struts 1的Open Flash Chart开发,准备在我的空间里把JOFC2中针对的各个图表的用法写出来,给大家做个借鉴
首先下载JOFC2的jar包,可以在http://code.google.com/p/jofc2/下载到,另外还有一个开发人员针对jofc2自己的扩展可以在http://ci.pentaho.com/job/JOFC2/下载到,以下代码我用到的包是前者。下面我们开始我们的jofc之旅....
一.jsp的写法:
<%@ page language="java" import="java.util.*" pageEncoding="ISO-8859-1"%>
<html>
<head>
<script type="text/javascript" src="js/swfobject.js"></script>
<script type="text/javascript" src="js/json2.js"></script>
<script type="text/javascript">
swfobject.embedSWF(
"open-flash-chart.swf",
"my_chart",
"40%",
"40%",
"9.0.0",
"expressInstall.swf",
{"data-file":"<%=request.getContextPath()%>/testAction.do"},
{wmode:"transparent"});
</script>
</head>
<body>
<p>Hello World</p>
<div id="my_chart"></div>
</body>
</html>
其中<%=request.getContextPath()%>/testAction.do就是指定的我们的Action的路径。
二.Struts Action:
以下代码是Struts1 Action中的execute的写法
1)PieChart 饼图:
public ActionForward execute(ActionMapping mapping, ActionForm form,
HttpServletRequest request, HttpServletResponse response) {
// TODO Auto-generated method stub
try{
PieChart pie = new PieChart();
pie.setFontSize(15);// 设置字体
pie.addSlice(200000000, " 实收费用 " );// 分类
pie.addSlice(60000000, " 欠费金额 " );
pie.addSlice(30000000, " 报停金额 " );
pie.addSlice(20000000, " 减免金额 " );
pie.setStartAngle(100);// 设置角度
pie.setAnimate( true );
// 设置颜色
pie.setColours( new String[] { "0x336699" , "0x88AACC" , "0x999933" ,
"0x666699" , "0xCC9933" , "0x006666" , "0x3399FF" , "0x993300" ,
"0xAAAA77" , "0x666666" , "0xFFCC66" , "0x6699CC" , "0x663366" ,
"0x9999CC" , "0xAAAAAA" , "0x669999" , "0xBBBB55" , "0xCC6600" ,
"0x9999FF" , "0x0066CC" , "0x99CCCC" , "0x999999" , "0xFFCC00" ,
"0x009999" , "0x99CC33" , "0xFF9900" , "0x999966" , "0x66CCCC" ,
"0x339966" , "0xCCCC33" });
pie.setTooltip( "#val# / #total#<br> 占百分之 #percent#");// 鼠标移动上去后提示内容
pie.setRadius(20);
Chart flashChart = new Chart( " 2009至2010年度 包烧费分析 " , "font-size:30px;color:#ff0000;" ); // 整个图的标题
//flashChart.setBackgroundColour("#3EFFFF");
flashChart.addElements(pie); // 把饼图加入到图表
String json = flashChart.toString();// 转成 json 格式
response.setContentType( "application/json-rpc;charset=utf-8" );
response.setHeader( "Cache-Control" , "no-cache" );
response.setHeader( "Expires" , "0" );
response.setHeader( "Pragma" , "No-cache" );
response.getWriter().print(json);// 写到客户端
}catch(Exception ex){
ex.printStackTrace();
}
return null;
}
显示效果如下:

2)BarChart 柱状图:
try{
BarChart chart = new BarChart(BarChart.Style. GLASS ); // 设置条状图样式
//FilledBarChart chart = new FilledBarChart("red","blue");// 设置条状图样式
//String sMax = "10000" ;
long max = 900; // //Y 轴最大值
Map<String,Long> map = new HashMap<String,Long>();
map.put( "5" , new Long(50));
map.put( "6" , new Long(45));
map.put( "7" , new Long(60));
map.put( "8" , new Long(30));
map.put( "9" , new Long(80));
map.put( "10" , new Long(500));
map.put( "11" , new Long(800));
map.put( "12" , new Long(200));
XAxis x = new XAxis(); // X 轴
int i = 5;
for (String key:map.keySet()){
x.addLabels(i+"月份"); // x 轴的文字
Bar bar = new Bar(map.get(""+i), " 万元 " );
i++;
bar.setColour( "0x336699" ); // 颜色
bar.setTooltip(map.get(""+i) + " 万元 " ); // 鼠标移动上去后的提示
chart.addBars(bar); // 条标题,显示在 x 轴上
}
Chart flashChart = new Chart();
flashChart.addElements(chart); // 把柱图加入到图表
YAxis y = new YAxis(); //y 轴
y.setMax(max+10.0); //y 轴最大值
y.setSteps(max/10*1.0); // 步进
flashChart.setYAxis(y);
flashChart.setXAxis(x);
String json = flashChart.toString();
response.setContentType( "application/json-rpc;charset=utf-8" );
response.setHeader( "Cache-Control" , "no-cache" );
response.setHeader( "Expires" , "0" );
response.setHeader( "Pragma" , "No-cache" );
response.getWriter().print(json);// 写到客户端
}catch(Exception ex){
ex.printStackTrace();
}
return null;
}
显示效果如下:

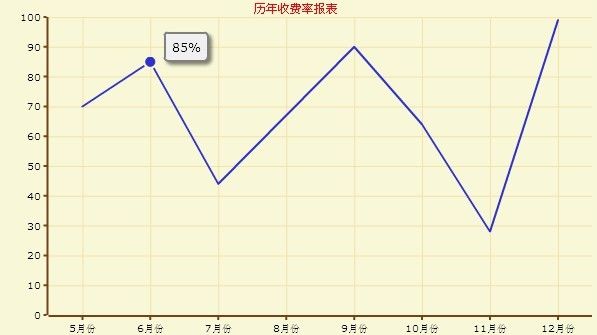
2)LineChart 折线图:
public ActionForward execute(ActionMapping mapping, ActionForm form,
HttpServletRequest request, HttpServletResponse response) {
// TODO Auto-generated method stub
try{
LineChart lineChart = new LineChart();
lineChart.setFontSize(15);// 设置字体
lineChart.setTooltip("#val#%");//设置鼠标移到点上显示的内容
LineChart.Dot dot1 = new LineChart.Dot(70);//按照顺序设置各个点的值
LineChart.Dot dot2 = new LineChart.Dot(85);
LineChart.Dot dot3 = new LineChart.Dot(44);
LineChart.Dot dot4 = new LineChart.Dot(67);
LineChart.Dot dot5 = new LineChart.Dot(90);
LineChart.Dot dot6 = new LineChart.Dot(64);
LineChart.Dot dot7 = new LineChart.Dot(28);
LineChart.Dot dot8 = new LineChart.Dot(99);
lineChart.addDots(dot1);//按照顺序把点加入到图形中
lineChart.addDots(dot2);
lineChart.addDots(dot3);
lineChart.addDots(dot4);
lineChart.addDots(dot5);
lineChart.addDots(dot6);
lineChart.addDots(dot7);
lineChart.addDots(dot8);
XAxis x = new XAxis(); // X 轴
x.addLabels("5月份");
x.addLabels("6月份");
x.addLabels("7月份");
x.addLabels("8月份");
x.addLabels("9月份");
x.addLabels("10月份");
x.addLabels("11月份");
x.addLabels("12月份");
//x.setColour("0x000000");
long max = 100; // //Y 轴最大值
YAxis y = new YAxis(); //y 轴
y.setMax(max+0.0); //y 轴最大值
y.setSteps(10); // 步进
Chart flashChart = new Chart( " 历年收费率报表 " , "font-size:12px;color:#ff0000;" ); // 整个图的标题
flashChart.addElements(lineChart); // 把饼图加入到图表
Text yText = new Text("历年缴费率曲线图",Text.createStyle(20, "#736AFF", Text.TEXT_ALIGN_CENTER));
flashChart.setYAxis(y);
flashChart.setXAxis(x);
flashChart.setYLegend(yText);//设置y轴显示内容
String json = flashChart.toString();// 转成 json 格式
response.setContentType( "application/json-rpc;charset=utf-8" );
response.setHeader( "Cache-Control" , "no-cache" );
response.setHeader( "Expires" , "0" );
response.setHeader( "Pragma" , "No-cache" );
response.getWriter().print(json);// 写到客户端
}catch(Exception ex){
ex.printStackTrace();
}
return null;
}
显示效果如下:

4)BarChart2 组合柱状图:
public ActionForward execute(ActionMapping mapping, ActionForm form,
HttpServletRequest request, HttpServletResponse response) {
// TODO Auto-generated method stub
try{
StackedBarChart chart = new StackedBarChart( ); // 设置组合柱状图
long max = 900; // //Y 轴最大值
Map<String,Long> map = new HashMap<String,Long>();
map.put( "5" , new Long(50));
map.put( "6" , new Long(45));
map.put( "7" , new Long(60));
map.put( "8" , new Long(30));
map.put( "9" , new Long(80));
map.put( "10" , new Long(500));
map.put( "11" , new Long(800));
map.put( "12" , new Long(200));
XAxis x = new XAxis(); // X 轴
x.set3D(0);
x.setColour("#909090");
x.setGridColour("#ADB5C7");
int i = 5;
for (String key:map.keySet()){
StackedBarChart.Stack stack = new StackedBarChart.Stack();//新建柱组
x.addLabels(i+"月份"); // x 轴的文字
StackedBarChart.StackValue stackValue = new StackedBarChart.StackValue(map.get(""+i),"0x336699");//每组柱状图每个柱的设置
StackedBarChart.StackValue stackValue2 = new StackedBarChart.StackValue(i * 5 + 10,"#3334AD");
StackedBarChart.StackValue stackValue3 = new StackedBarChart.StackValue(i * 10 + 20,"#D54C78");
i++;
stack.addStackValues(stackValue);
stack.addStackValues(stackValue2);
stack.addStackValues(stackValue3);
chart.addStack(stack); // 条标题,显示在 x 轴上
}
StackedBarChart.Key key1 = new StackedBarChart.Key("0x336699","包烧费",10);
StackedBarChart.Key key2 = new StackedBarChart.Key("#3334AD","热表收费",10);
StackedBarChart.Key key3 = new StackedBarChart.Key("#D54C78","生活热水收费",10);
chart.addKeys(key1);
chart.addKeys(key2);
chart.addKeys(key3);
Chart flashChart = new Chart("组合柱状图","{font-size:20px; color: #FFFFFF; margin: 5px; background-color: #505050; padding:5px; padding-left: 20px; padding-right: 20px;}");
flashChart.addElements(chart); // 把柱图加入到图表
YAxis y = new YAxis(); //y 轴
y.set3D(0);
y.setColour("#909090");
y.setGridColour("#ADB5C7");
y.setMax(max+10.0); //y 轴最大值
y.setSteps(max/10*1.0); // 步进
flashChart.setYAxis(y);
flashChart.setXAxis(x);
Text text = new Text("Open Flash Chart 3D Bar");
text.setStyle(Text.createStyle(15, "#736AFF", Text.TEXT_ALIGN_RIGHT));
flashChart.setYLegend(text);//设置Y轴左侧的文字
String json = flashChart.toString();
response.setContentType( "application/json-rpc;charset=utf-8" );
response.setHeader( "Cache-Control" , "no-cache" );
response.setHeader( "Expires" , "0" );
response.setHeader( "Pragma" , "No-cache" );
response.getWriter().print(json);// 写到客户端
}catch(Exception ex){
ex.printStackTrace();
}
return null;
}
显示效果如下图

|