JFreeChart 之三:折线图实现
JFreeChart 之一:柱状图实现
JFreeChart 之二:饼状图实现
准备工作与相关环境参考JFreeChart之一
以下介绍折线图的实现
Action
/*  Action: */
// 从数据库中查询 需要显示的数据
List list = commonService.findBySql(query);

TimeSeriesCollection lineDataset = new TimeSeriesCollection();
TimeSeries timeSeries = new TimeSeries("人员录入总数统计", Month.class);
int count=0;
if(list!=null && list.size()>0){
	int len = list.size();
	// 组建数据
	for(int i=0;i<len;i++){
		Object[] obj = (Object[]) list.get(i);
		count+=new Double (obj[1].toString());
		timeSeries.add(new Month(Integer.parseInt(obj[0].toString()), Integer.parseInt(year)), new Double (obj[1].toString()));
	}
	lineDataset.addSeries(timeSeries);
}
JFreeChart chart = ChartFactory.createTimeSeriesChart("人员录入总数统计", "月份", "人数", lineDataset, true, true, true);
//设置子标题
TextTitle subtitle = new TextTitle(year+"年度   总记录:"+count, new Font("宋体", Font.BOLD, 12));
chart.addSubtitle(subtitle);
//设置主标题
chart.setTitle(new TextTitle("人员录入总数统计", new Font("宋体", Font.ITALIC, 15)));
chart.setAntiAlias(true);

JFreeChartUtil.timeSeriesStyle(chart);

String filename = ServletUtilities.saveChartAsPNG(chart, 800, 400,null, request.getSession());
String pieUrl = request.getContextPath()+ "/servlet/DisplayChart?filename=" + filename;
request.setAttribute("chartUrl", pieUrl);
JFreeChartUtil.timeSeriesStyle
public static void timeSeriesStyle(JFreeChart chart) {
		XYPlot plot  = chart.getXYPlot();
		/* 设置曲线显示各数据点的值  */
		XYLineAndShapeRenderer xylineandshaperenderer = (XYLineAndShapeRenderer)plot.getRenderer();
		//设置网格背景颜色
		plot.setBackgroundPaint(Color.white);
		//设置网格竖线颜色
		plot.setDomainGridlinePaint(Color.pink);
		//设置网格横线颜色
		plot.setRangeGridlinePaint(Color.pink);
		//设置曲线图与xy轴的距离
		plot.setAxisOffset(new RectangleInsets(0D, 0D, 0D, 10D));
		//设置曲线是否显示数据点
		xylineandshaperenderer.setBaseShapesVisible(true);
		//设置曲线显示各数据点的值
		XYItemRenderer xyitem = plot.getRenderer();
//		xyitem.setBaseItemLabelsVisible(true);
		xyitem.setBasePositiveItemLabelPosition(new ItemLabelPosition(ItemLabelAnchor.OUTSIDE12, TextAnchor.BASELINE_LEFT));
		xyitem.setBaseItemLabelGenerator(new StandardXYItemLabelGenerator());
		xyitem.setBaseItemLabelFont(new Font("Dialog", 1, 14));
		plot.setRenderer(xyitem);

		// 中文处理乱码
		Font xfont = new Font("宋体",Font.PLAIN,12) ;// X轴
		Font yfont = new Font("宋体",Font.PLAIN,12) ;// Y轴
		// X 轴
		ValueAxis domainAxis = plot.getDomainAxis();
		domainAxis.setLabelFont(xfont);// 轴标题
		domainAxis.setTickLabelFont(xfont);// 轴数值
		domainAxis.setTickLabelPaint(Color.BLUE) ; // 字体颜色
		// Y 轴
		ValueAxis rangeAxis = plot.getRangeAxis();
		rangeAxis.setLabelFont(yfont);
		rangeAxis.setLabelPaint(Color.BLUE) ; // 字体颜色
		rangeAxis.setTickLabelFont(yfont);

		// 底部
		chart.getLegend().setItemFont( new Font("宋体",Font.PLAIN,12));
	}
JSP
<img src="${chartUrl}" mce_src="${chartUrl}" />
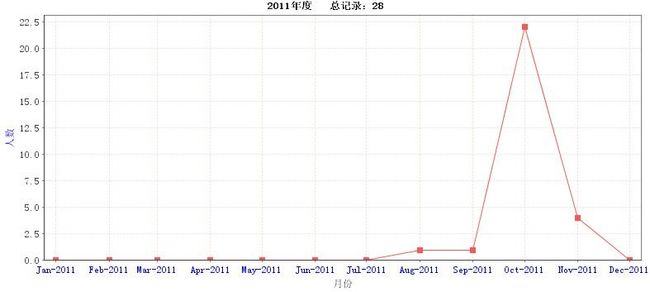
效果