Matlab 一维插值interp1 例子 及 可视拟合界面
一维插值:
已知离散点上的数据集 ,即已知在点集X上对应的函数值Y,构造一个解析函数(其图形为一曲线)通过这些点,并能够求出这些点之间的值,这一过程称为一维插值。
MATLAB命令:yi=interp1(X, Y, xi, method)
该命令用指定的算法找出一个一元函数 ,然后以 给出 处的值。xi可以是一个标量,也可以是一个向量,是向量时,必须单调,method可以下列方法之一:
‘nearest’:最近邻点插值,直接完成计算;
‘spline’:三次样条函数插值;
‘linear’:线性插值(缺省方式),直接完成计算;
‘cubic’:三次函数插值;
对于[min{xi},max{xi}]外的值,MATLAB使用外推的方法计算数值。
%-- 09-4-1 下午8:38 --%
%已知数据
t=1900:10:1990;
p=[75.995,91.972,105.711,123.203,131.669,150.697,179.323,203.212,226.505,249.633];
x=1900:0.01:1990;
%使用不同的方法进行一维插值
yi_linear=interp1(t,p,x); %线性插值
yi_spline=interp1(t,p,x,'spline');%三次样条插值
yi_cubic=interp1(t,p,x,'cubic');%三次多项式插值
yi_v5cubic=interp1(t,p,x,'v5cubic');%matlab5中使用的三次多项式插值
%绘制图像对比
subplot(2,1,1);
plot(t,p,'ko');
hold on;
plot(x,yi_linear,'g','LineWidth',1.5);grid on;
plot(x,yi_spline,'y','LineWidth',1.5);
title('Linear VS Spline ')
subplot(2,1,2);
plot(t,p,'ko');
hold on
plot(x,yi_cubic,'g','LineWidth',1.5);grid on;
plot(x,yi_v5cubic,'y','LineWidth',1);
title('Cubic VS V5cubic ');
%创建新图形窗口
figure
yi_nearest=interp1(t,p,x,'nearest');%最邻近插值法
plot(t,p,'ko');
hold on
plot(x,yi_nearest,'g','LineWidth',1.5);grid on;
title('Nearest Method');
%以下是根据拟合估计
msg=' year Cubic Linear Nearest Spline';
for i=0:8
n=10*i;
year=1905+n;
pop(i+1,1)=year;
pop(i+1,2)=yi_cubic((year-1900)/0.01+1);
pop(i+1,3)=yi_linear((year-1900)/0.01+1);
pop(i+1,4)=yi_nearest((year-1900)/0.01+1);
pop(i+1,5)=yi_spline((year-1900)/0.01+1);
end
P=round(pop);
disp(msg)
disp(P)
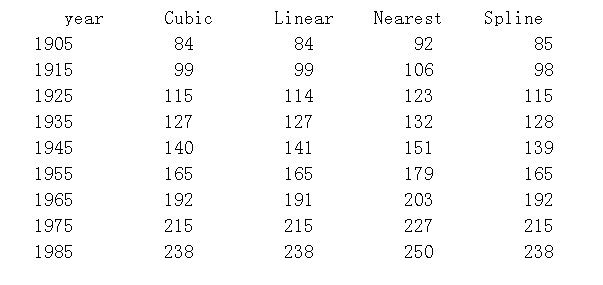
结果如图:
由此可见,各种插值的优劣,在速度上,Nearest最快,然后是Linear再到Cubic,最慢的是Splic.但是精度和曲线的平滑度恰好相反,Nearest甚至不连续~~
系统默认的是Linear


