Introduction
This is part 4 of a 4 part blog explaining how the BPM engine functions under the covers when “faults” occur, be they unhandled technical faults or failures at the engine level.
Part 1 can be foundhere.
Part 4: BPM Message Recovery
Idempotence
It is vitally important to understand the conept of idempotence, i.e. the ability to replay activities more than once without any adverse impact. As an example, an activity to credit money to a bank account would not be idempotent whereas an activity to query the money on a bank account would be. This is important since recovering process instances necessarily means that some activities will be replayed. It is a business decision as to whether this recovery of instances is valid or not.
Recover Individual Instances
As a first step, let’s look at how to recover the individual instances that have failed.
Pattern 1 – Async – Async
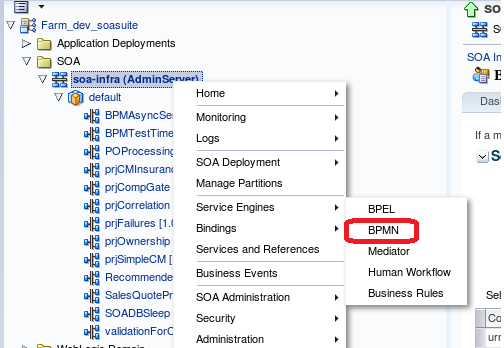
Via the Enterprise Manager Console we can view the BPMN engine….
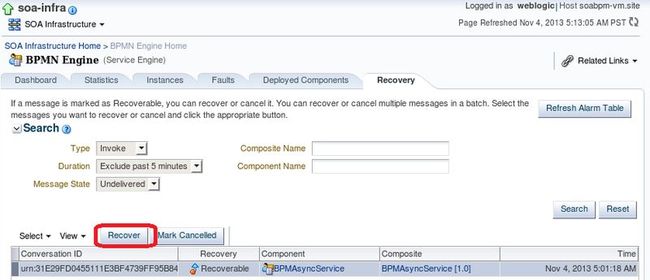
…and from the “Recovery” tab we can see any uncompleted “Invoke” activities (excluding the last 5 minutes as this is an active table)….
…and there we see the failed instance which we can recover.
Pattern 2 – Async – Sync
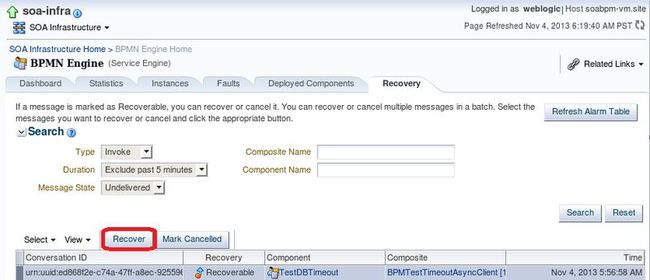
Via the Enterprise Manager Console as before…
Pattern 3 – Async with Acknowledgement – Sync
Via the Enterprise Manager Console as before…
…we can’t see the latest instance since it was not rolled back to an invoke, but we can see the actual activity itself, this however is not recoverable….
We know that it has rolled back to the timer activity and we can recover this by simply clicking the “Refresh Alarm Table” button shown, note that this will refresh all timers, it is a bulk operation. Note this button is only available in PS6 and later versions.
Bulk Recovery of Instances
Now that we have seen how to find and recover individual instances which have failed with various patterns, let’s look at how we can query and recover in bulk. It could be the case that a catastrophic failure has caused managed servers to crash resulting in potentially thousands of failed process instances and at multiple different activities within them.
How do we find all “stuck” instances ? Which ones will recover automatically and which will have to be manually recovered ?
Automatic Recovery – Undelivered Messages
By default BPM instances are not recovered automatically on managed server restart, as opposed to BPEL instances which are. This can be verified, or changed if required, in the Enterprise Manager Console (remember idempotence !)….
…i.e. on startup, recover all instance during a duration of 0 seconds.
Automatic Recovery – Failed Timers
In contrast, on server restart all timers will re-fire, i.e. in “Pattern 3”, on server restart, the “catchEvent” timer activity will fire again. Also worth noting is any timers which expired whilst the managed server was down will also fire on restart… this could cause a large spike in activity on restart if multiple instances with expired timers are retried.
Note also what exactly this “refresh” does – when a WORK_ITEM entry is created for a timer, be it a simple “sleep”….
…or a boundary timer on an activity….
…then an in-memory timer is created scheduled from the transaction commit listener, when the in-memory timer expires the WORK_ITEM table is updated.
A “refresh” will re-invoke the active entries in the WORK_ITEM table thus creating new instances of those in-memory timers, it will not however reset these timers to “zero”, i.e. begin the time period again.
Recovery Queries
The above scenarios have covered some common patterns and the message recovery associated with them. The provided scripts cover all possible “stuck instance” scenarios, how to find the instances and how to recover them in bulk.
It is advisable to agree on a fixed point in time for the recovery window. This will ensure that, when you run the various queries we are about to describe, you will get a consistent set of results. The queries below include “receive_date < systimestamp – interval ‘1’ minute” this is to avoid including in-flight instances. However, you may augment this to query for “stuck” messages up to a particular cut-off date e.g. 01-August 2013.
Querying the DLV_MESSAGE table – Find the “unresolved” messages
As a reminder, the valid values for the STATE column.
“Stuck” messages will be those with the values 0 or 4. “0 – STATE_UNRESOLVED” as we saw earlier in our example scenarios, “4 – STATE_MAX_RECOVERED” could occur if auto-recovery was set to on, or if someone had retried a number of times to resubmit the message from Enterprise Manager Console.
We have 2 types of messages – Invoke and Callback. Invoke à DLV_TYPE = 1, Callback à DLV_TYPE = 2
We can query the “stuck” messages for each type as follows….
Simple query on the DLV_MESSAGE table…
- Group by the dlv_type, composite and component allowing us to isolate where the bulk of the “stuck” messages are.
- Optionally separate the query into two parts, one for “Invoke”, one for “Callback”
…when we run this for our failed scenarios we get the results as expected….
Querying the DLV_MESSAGE table – for FYI messages
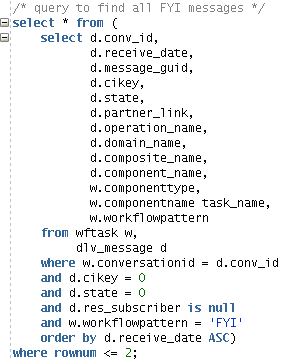
In production scenarios, there may be some rows that you can discard immediately – for example FYI tasks cause messages to be written to the DLV_MESSAGE table – these can essentially be ignored. You could use the following SQL to get themessage_guidof such messages and then mark them as cancelled using the Recovery API. Use of the API will be discussed late, suffice to know the example class is calledBatchMessageCancelForFYI, included in the Java examples that accompany this document. You may also consider updating the human task (for FYI) as a workaround to avoid these extra messages. See Patch 16494888.
Querying the DLV_MESSAGE table – Drilling Deeper
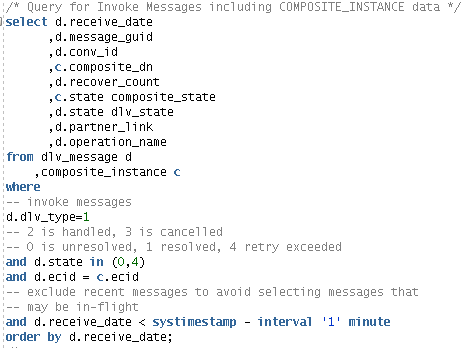
We can now concentrate on the “stuck” messages and drill a little deeper to get some context e.g. what activity caused the problem. To do this we can query further tables…. COMPOSITE_INSTANCE, COMPONENT_INSTANCE, CUBE_INSTANCE, WORK_ITEM, BPM_AUDIT_QUERY.
Drill down to COMPOSITE_INSTANCE data…
…when we run this for our failed scenarios we get the following….
…i.e we can see here that “Pattern 1” at 05:01 failed (COMPOSITE_STATE = 2) in the “BPMAsyncService” process and that “Pattern 2” at 05:56 failed in the “BPMTestTimeoutAsyncClient” exactly as shown in the failure images above.
Drill down to CUBE_INSTANCE data….
Here we can get information on cube state and scope size….
…when we run this for our failed scenarios…
…we can see that “Pattern 1” failed in “BPMAsyncService” and “Pattern 2” failed in “BPMTestTimeoutAsyncClient” as a CUBE_INSTANCE_STATE of “10 – STATE_CLOSED_ROLLED_BACK”
Drill down to CUBE_INSTANCE data….
We can now see to what activity we rolled back….
…and for our failed scenarios….
…this is interesting, we now only see the failure for “Pattern 1”, not for “Pattern 2”, why ? Well, remember “Pattern 2” rolled back all the way to the “Start” message of the client process so no active WORK_ITEM rows exist.
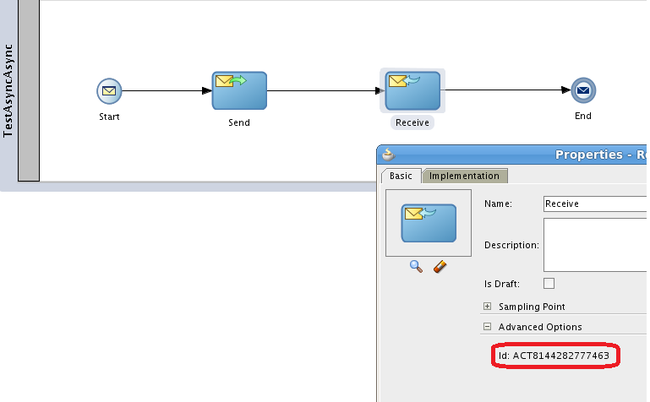
For “Pattern 2” we can see that we reached “SCOPE_ID=TestAsyncAsync_try.2” and “NODE_ID=ACT8144282777463”, looking at the original process model….
…we can see that the passivation point on the “Receive” activity created a WORK_ITEM entry with state “3 – OPEN_PENDING_COMPLETE”.
Drill down to BPM_AUDIT_QUERY data….
If auditing was enabled, we can now see which was the last activity audited….
…and for our failed scenarios…
…we can see for “Pattern 1” the last audited activity before rollback was “ScriptTask”, i.e. we know that it was here we had a failing data association, and for “Pattern 2” the last audited activity was “DBCall”, i.e. it was here that the process timed out.
Timer Queries
Expired Timers
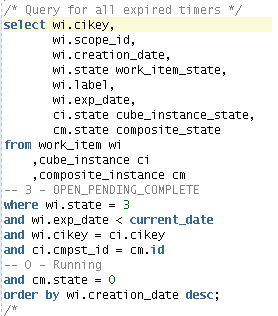
In the case where a server has crashed it can be very useful to know how many timers have expired in the downtime, given that on restart of the server they will all re-fire. We can query these as follows….
…i.e. return all timers that had an expiry date in the past but are still “open_pending_complete” and the composite instance is still “running”.
Failed Timers
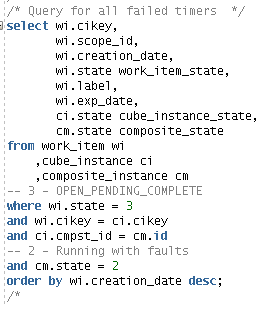
The other area where timers could be incomplete is in our scenario 3, although the timer completed the transaction which completed it has rolled back. We can query these as follows….
i.e. return all timers that are still “open_pending_complete” and the composite instance is “running with faults”.
For our failed scenario 3 we can see the results of this query….
Recovery Queries Conclusion
From the above queries it is possible to get a view on what instances have failed, what activity they reached when failure occurred and to where they rolled back. With this information it is possible to determine whether recovery is possible from a business perspective (idempotency) and to infer patterns from failures to try to minimize re-occurrence.
Leveraging the Recovery API
Before running recovery, you may want to backup your SOA_INFRA database.
Briefly, this is the Recovery API example that goes with this blog….
The previous sections described the SQL queries that find the messages in need of re-submission. Essentially the result of these queries (message_guid) will be fed in to either recover invoke, recover callback, or cancel the message.
These APIs are in addition to what’s documented for fault recoveryhere.
Cancel FYI Task messages in the DLV_Message Table
Extract from “BatchMessageCancelForFYI”…
These cancelled messages will be picked up by the next SOA_INFRA purge assuming that a purge strategy is in place.
Batch Recovery of messages in the DLV_Message Table
Here we recover the message(s) using the “message_guid”, extract from “BatchMessageRecovery”….
Refreshing Timers
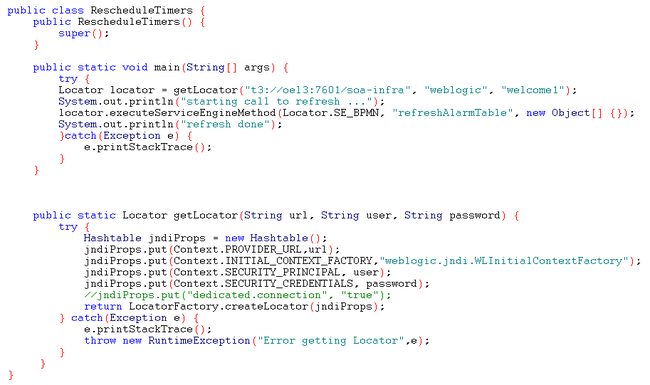
Unlike the examples above, refreshing timers does not leverage the Recovery API. As previously mentioned, timers can be simply refreshed from the Enterprise Manager Console in PS6 and beyond, or with a simple API call to the “refreshAlarmTable” method on the BPMN Service Engine thus….
Summary
In this four part blog we have taken a deep dive into how the BPM engine handles messages, threads, rollbacks & recovery. Whenever we hear from a customer “my message is stuck” or “I’ve lost one of my process instances” we should now know where to look and how to recover it.
Attached to this blog is the JDev project with all SQL queries to find rolled back messages and all java code to recover them….
All site content is the property of Oracle Corp. Redistribution not allowed without written permission








Hi Mark,
Thanks for this Article, it has been really useful.
With respect to the BPM Alarm ‘refresh’. When using the programmatic call described in your reschedule timers Java class,
Do you have to target each SOA server in a multi node cluster?
Or are you supposed to target the cluster name?
Or should a call to one server suffice to refresh all of them?
The ListTimers java project implies to get the instances associated to a server, you target each server individually in a comma separated list, which makes sense.
I just wasn’t sure the same reasoning could be applied to the rescheduling.
thanks,
Nick