Firebug Tutorial
Section 1: Console Tab : Logging, Profiling and CommandLine (Part II)
Overview of Console Tab
This tab is mainly used for logging. It also can be used as CommandLine window (like immediate window in Microsoft Visual Studio) while you are debugging the Javascript. It can be used for monitoring the execution of Javascript code by using Profiling service.
The following topic will be covered in this section.
- Logging in Firebug (with String Substitution pattern )
- Grouping the logs or messages
- console.dir and console.dirxml
- Assertion ( console.assert() )
- Tracing ( console.trace() )
- Timing ( Measuring the time of your code)
- Javascript Profiler (An introduction in this tutorial, the details will be covered in next tutorial.)
#1. Logging in Firebug
Firebug supports logging in Console tab. So, you don’t need to use alert(‘something’) or document.write(‘something’) anymore.
There are five types of logging in Firebug.
- console.log : Write a message without icon.
- console.debug : Writes a message to the console, including a hyperlink to the line where it was called
-
 console.error() : Writes a message to the console with the visual “error” icon and color coding and a hyperlink to the line where it was called.
 -
 console.info() : Writes a message to the console with the visual “info” icon and color coding and a hyperlink to the line where it was called.
 -
 console.warn() : Writes a message to the console with the visual “warning” icon and color coding and a hyperlink to the line where it was called.
Example Code:
- Open the htm file called “Plain HTML” or create one HTML file.
- Paste the following code with <body> tag.
<script language="javascript" type="text/javascript">
console.log('This is log message');
console.debug('This is debug message');
console.error('This is error message');
console.info('This is info message');
console.warn('This is warning message');
</script>
You will get the following output. If you click on hyperlink (“test.htm” in this case), it will take you to script tab and will highlight the line that wrote this message.
String Substitution Patterns
String substitution parterns can be used in console.log, console.info, console.debug, console.warn and console.error . You can use the same way that we used in C/C++.
| %s | String |
| %d, %i | Integer (numeric formatting is not yet supported) |
| %f | Floating point number (numeric formatting is not yet supported) |
| %o | Object hyperlink |
Example :
Note: I will use console.log in the example below even all console objects (console.log, console.info, console.debug, console.warn and console.error ) support string substitution.
- Remove “script” tag that we pasted for the previous example.
- Paste the code below within <body> tag.
<script language="javascript" type="text/javascript">

//This is for normal string substitution " %s, %d, %i, %f".
console.log("My Name is <strong>%s</strong>. My Date of Birth is <strong>%dth %s, %i</strong>. My height is <strong>%f</strong> m.", "Nicolas Cage", 7, 'January', 1964, 1.8542);

function Foo(){
this.LeftHand = function(){
return "Left Hand";
}
this.RightHand = function(){
return "Right Hand";
}
}

//This is for object "%o".
var objFoo = new Foo();
console.log('This is <strong>%o</strong> of Foo class.', objFoo);

</script>
If you are using %o in your log, the object will be shown as a hyperlink in green color. This hyperlink is linked to the DOM tab. So, If you click “object” in second line, you will see the list of properties of that object (LeftHand and RightHand in this case.)
#2. Grouping
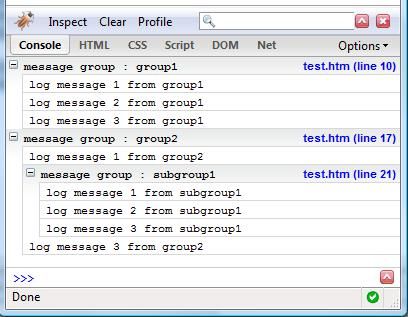
Firebug allows you to group the message or log in Console tab. If you have some many logs in your code, you can probably divide your log into small group or subgroup
Example ~
<script language="javascript" type="text/javascript">

var groupname = 'group1';
console.group("message group : %s " , groupname);
console.log("log message 1 from %s", groupname);
console.log("log message 2 from %s", groupname);
console.log("log message 3 from %s", groupname);
console.groupEnd();

groupname = 'group2';
console.group("message group : %s " , groupname);
console.log("log message 1 from %s", groupname);

var subgroupname = 'subgroup1';
console.group("message group : %s " , subgroupname);
console.log("log message 1 from %s", subgroupname);
console.log("log message 2 from %s", subgroupname);
console.log("log message 3 from %s", subgroupname);
console.groupEnd();

console.log("log message 3 from %s", groupname);
console.groupEnd();

</script>
#3. console.dir and console.dirxml
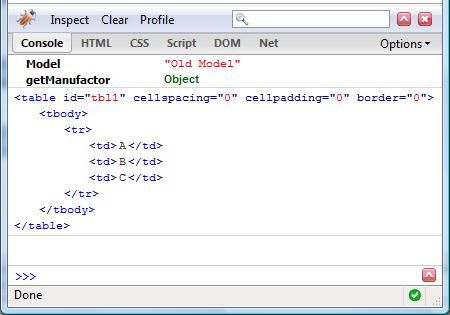
- console.dir : It can be used for getting all properties and methods of a particular object. According the example below, we can get the Model (property) and getManufactor (method) of Car object by using console.dir(); You can also pass the object of HTML element (eg: console.dir(document.getElementById(‘tbl1′)); ) instead of objCar and let’s see the result. (You will get all properties and methods of the HTML table called “tbl1′).
- console.dirxml : print the XML source tree of HTML element.
<table id="tbl1" cellpadding="0" cellspacing="0" border="0">
<tr>
<td>A</td>
<td>B</td>
<td>C</td>
</tr>
</table>
<script language="javascript" type="text/javascript">
//Create a class
function Car(){
this.Model = "Old Model";

this.getManufactor = new function(){
return "Toyota";
}
}

//Create a object
var objCar = new Car();

//Firebug
console.dir(objCar);
console.dirxml(document.getElementById('tbl1'));

</script>
#4. Assertion ( console.assert() )
You can use console.assert() to test whether an expression is true or not. If the expression is false, it will write a message to the console and throw an exception.
Example :
<script language="javascript" type="text/javascript">
function whatIsMyAge(year){
var currYear = 2007;
return currYear - year;
}

var yearOfBirth1 = 1982;
var age1 = 25;
console.assert(whatIsMyAge(yearOfBirth1) == age1);

var yearOfBirth2 = 1982;
var age2 = 11;
console.assert(whatIsMyAge(yearOfBirth2) == age2); //You should get the error here.
</script>
#5. Tracing ( console.trace() )
This function is very interesting. Before I tell you the way that I understand, let’s take a look what console.trace does exactly in official website.
console.trace()
Prints an interactive stack trace of JavaScript execution at the point where it is called.
The stack trace details the functions on the stack, as well as the values that were passed as arguments to each function. You can click each function to take you to its source in the Script tab, and click each argument value to inspect it in the DOM or HTML tabs.
This function will tell you about the route information from start point to end point. If you are not clear what I mean, let’s take a look at the sample code and the result.
<!DOCTYPE html PUBLIC "-//W3C//DTD XHTML 1.0 Transitional//EN" "http://www.w3.org/TR/xhtml1/DTD/xhtml1-transitional.dtd">
<html xmlns="http://www.w3.org/1999/xhtml" >
<head>
<title>Firebug</title>
<script language="javascript" type="text/javascript">
function startTrace(str){
return method1(100,200);
}
function method1(arg1,arg2){
return method2(arg1 + arg2 + 100);
}
function method2(arg1){
var var1 = arg1 / 100;
return method3(var1);
}
function method3(arg1){
console.trace();
var total = arg1 * 100;
return total;
}

</script>
</head>
<body>
<input type="button" value="Trace" onclick="startTrace('Result');"/>
</body>
</html>
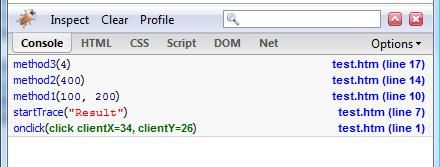
Suppose: we wanna know how “method3′ function is invoked. So, we put this code “console.trace()” in that method. then, we run the program and we got the result as picture above. If we read the result from bottom to top, we will see “onclick(click clientX=34, clientY=26)”. That means the execution of Javascript started at on click event of button. then, we got “startTrace(“Result”)” in second line. That means startTrace function is invoked after firing onclick event and the parameter is “Result”. If we keep on checking from bottom to top, we will figure out the completed route from onclick event to method3.
If you wanna test more, you can move this code “console.trace()” to method2(). then, firebug will give the new route from onclick event which is a started point to method2() which is the end point.
I think that it’s pretty useful if you are debugging the other developer’s source code and you have no idea why this function is invoked.
Let me know if you are not clear what I’m trying to explain about console.trace();.
#6. Timing ( Measuring the time of your code)
You can use console.time(timeName) function to measure how long a particular code or function take. This feature is very helpful if you are trying to improve the performance of your Javascript code.
Example :
<!DOCTYPE html PUBLIC "-//W3C//DTD XHTML 1.0 Transitional//EN" "http://www.w3.org/TR/xhtml1/DTD/xhtml1-transitional.dtd">
<html xmlns="http://www.w3.org/1999/xhtml" >
<head>
<title>Firebug</title>
<script language="javascript" type="text/javascript">
function measuretheTime(){
var timeName = 'measuringTime';
console.time(timeName);
for(var i=0;i<1000;i++){
///do something
for(var j=0;j<100;j++){
//do another thing.
}
}
console.timeEnd(timeName);
}
</script>
</head>
<body>
<input type="button" value="Trace" onclick="measuretheTime();"/>
</body>
</html>
Result : measuringTime: 16ms
#7. Javascript Profiler
You can start the profiler thought code (console.profile(‘profileName’)) or by clicking “Profile” button from “Console” tag. It can be used for improving the performance of Javascript. It is similiar to the console.time() function but profiler can give your more advanced and detailed information.
I will tell you about this more details in next tutorial (Part2) . I hope you all are clear about this tutorial. If you have any comment or suggestion, please drop a comment.. Thanks. C ya tomorrow.
Reference ~
- Console API


