Firebug Tutorial
Section 1: Console Tab : Using Commandline API in Firebug
Introduction
Commandline is one of the most useful features of Firebug. If you have some experiences in using Microsoft Visual Studio, you may know the usefulness of “Immediate window” and “Watch window” of VS while you are debugging.
Firebug’s commandline is like the “immediate window” from Visual Studio. You can inspect the value of a particular object at anytime. One better thing with firebug’s commandline is that it can be used at design-time also. ( Note: “Immediate” window from VS can be used at debugging-time only). And, another advantage is that you can write the Javascript Code in commandline and execute those codes on the fly.
The list of Commandline APIs for Firebug are available in the official website of Firebug. [ link: http://getfirebug.com/commandline.html]. What I’m going here is that I’m gonna write about all Commandline APIs with examples in this tutorial. I hope that you will find it useful.
Types of CommandLine
There are two types of Commandline in Console panel.
- One-line Commandline
- Multi-lines Commandline
One-line Commandline
This one is the default one for Console panel of Firebug. It allows you to write one line at a time. The advantage of one-line commandline is that it supports autocomplete feature.
What is Autocomplete?(Ref: http://getfirebug.com/cl.html)
Using the tab key you can autocomplete the name of variables and object properties. Keep hitting it to cycle through the complete set of possibilities, and use shift-tab to go backwards.
Autocomplete works at many levels. You can start hitting tab before you type anything to cycle through global variables. You can hit tab after typing “document.b” to cycle thorugh all properties that start with “b”. You can even hit tab after a complex expression like “document.getElementsByTagName(‘a’)[0].” to see all properties of the first link in the document.
Plus, You can also use “Up” or “Down” keys to get the command that you typed earlier.
Multi-lines Commandline
The multi-lines commandline is the enhancement version of one-line commandline. It allows you to type the Javascript code more than one time. And you can execute the code on the fly.
Both one-line commandline and multi-lines commandline have their own advantages. So, you can use either one based on what you wanna do with Firebug. For me, I used to use one-line commandline at the most of the time.
CommandLine API with example
Before start reading the tutorials, note that all of those APIs can be used both design time or run-time. However, those are more useful while you are in debugging mode. I’m telling you this because you may wonder why you need those APIs. :)
Download ~ Demo Zip File
List of APIs
- $(id)
- $$(selector)
- $x(xpath)
- dir(object)
- dirxml(node)
- cd(window)
- clear()
- inspect(object[, tabName])
- keys(object)
- values(object)
- debug(fn) & undebug(fn)
- monitor(fn) & unmonitor(fn)
- monitorEvents(object[, types]) & unmonitorEvents(object[, types])
- profile([title]) & profileEnd()
#1. $(id)
Returns a single element with the given id.
This is the shortcode for document.getElementById(”) in Javascript.
Example ( 1.0 )~
<body>
Name : <input id="nameTextBox" class="normalText" type="text" />
</body>
How-to ~
- Paste the code above in blank HTML file and open it in Firebug.
- Open the Firebug console and click “Console” tab.
- Type $(‘nameTextBox’) in CommandLine and Press Enter Key
Output ~
It seems very simple (and looks like not very useful) but I would say that it is useful while you are debugging the code or writing the script in multi-lines commandline.
Let’s see how to use multi-lines commandline, how to execute the Javascript on the fly.
- Click “Options > Larger Command Line”
- Copy the code below and paste them in multi-lines commandline (larger commandline).
- Click “Run”
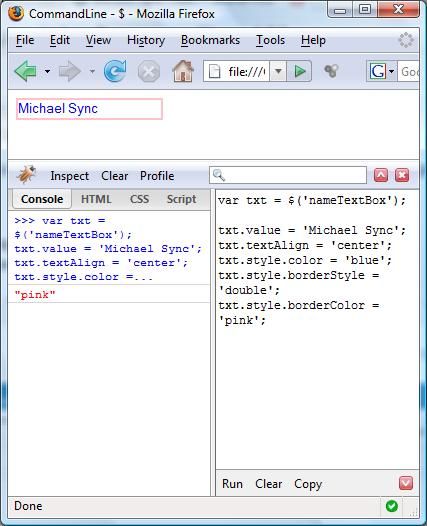
var txt = $('nameTextBox');

txt.value = 'Michael Sync';
txt.textAlign = 'center';
txt.style.color = 'blue';
txt.style.borderStyle = 'double';
txt.style.borderColor = 'pink';
Output ~
#2. $$(selector)
Returns an array of elements that match the given CSS selector.
Note: Check the link here if you don’t know what CSS selector is.
Example ( 1.1 )~
<!DOCTYPE html PUBLIC "-//W3C//DTD XHTML 1.0 Transitional//EN" "http://www.w3.org/TR/xhtml1/DTD/xhtml1-transitional.dtd">
<html xmlns="http://www.w3.org/1999/xhtml" >
<head>
<title>Firebug</title>
<style type="text/css">
div{
background-color:Black;color:White; border: solid 1px grey;
}
</style>
</head>
<body>
<div id='div1'>This is DIV1.</div>
<br />
<div id='div2'>Here is one more.</div>
</body>
</html>
Note: I’m using “Type CSS selector” in this sample.
How-to ~
- Type $$(‘div’) in CommandLine and Press Enter Key (You will get both div objects (div1 and div2) as an array. )
#3. $x(xpath)
Returns an array of elements that match the given XPath expression.
Note: If you have no idea about XPath, you may check the XPath tutorial here [^].
Example ( 1.2 )~
<!DOCTYPE html PUBLIC "-//W3C//DTD XHTML 1.0 Transitional//EN" "http://www.w3.org/TR/xhtml1/DTD/xhtml1-transitional.dtd">
<html xmlns="http://www.w3.org/1999/xhtml" >
<head>
<title>CommandLine - $</title>
</head>
<body>
<div id='container' style="width:800px">
<div id='leftsidebar' style="width:100px; background-color:Gray;min-height:400px;float:left;"> </div>
<div id='content' style="width:600px;min-height:400px; background-color:ThreeDShadow;float:left;">
<div id='content-header' style="padding:2px;font-family:Calibri,Trebuchet MS;">
<h2>All about Firebug</h2>
</div>
<div id='content-body' style="padding:2px;font-family:Calibri,Trebuchet MS;">
<p>Firebug is the most popular tool in web revolution.</p>
</div>
</div>
<div id='rightsidebar' style="width:100px; background-color:Gray;height:400px;float:right;"></div>
</div>
</body>
</html>
We will test this API in multi-lines commandline.
Paste the code below in multi-lines commandline.
var obj = $x('html/body/div/div');
console.log(obj[0].id);
console.log(obj[1].id);
console.log(obj[2].id);
Output ~
#4. dir(object)
Prints an interactive listing of all properties of the object. This looks identical to the view that you would see in the DOM tab.
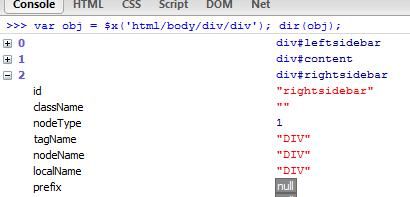
It is like console.dir() that I already mentioned in Part I. So, I think you already have some idea about what console.dir is and how to use. I’m not going to write the new HTML code for this example. Instead, I will use the previous example (eg 1.2) and I will change the Javascript code that I wrote in multi-lines commandline.
var obj = $x('html/body/div/div');
<strong>dir(obj);</strong>
The result will be like the pic below. You will get all properties and methods of those three DIV objects (leftsidebar, content, rightsidebar).
#5. dirxml(note)
Prints the XML source tree of an HTML or XML element. This looks identical to the view that you would see in the HTML tab. You can click on any node to inspect it in the HTML tab.
I already showed you how to use console.dirxml() in this tutorial. Only one thing is different. You can type dirxml() (eg: dirxml(‘container’) with the example 1.2.) in commandline instead of writing in HTML file.
#6. cd(window)
By default, command line expressions are relative to the top-level window of the page. cd() allows you to use the window of a frame in the page instead.
Note: This API seems doesn’t work properly. I will inform to Firebug team and will let you know the result.
#7. clear()
Clears the console. If you wanna clear the console, just type this “clear()” in commandline and press “Enter” key. You can also use “console.clear()” in Javascript Code.
#8. inspect(object[,tabName])
Inspects an object in the most suitable tab, or the tab identified by the optional argument tabName.
The available tab names are “html”, “css”, “script”, and “dom”.
How-to ~
- Open “example 1.2′ in firefox.
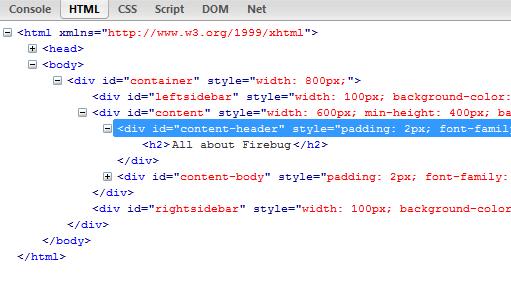
- Type inspect($(‘content-header’),’html’) in one-line commandline.
- The HTML tab will be opened and the DIV called “content-header” will be selected. (check the pic below)
#9. keys(object)
Returns an array containing the names of all properties of the object. The object can be either Javascript object ( eg: var objCar = new Car() ) or HTML element (eg: document.getElementById(‘table1′)).
Example 1.4 ~
<!DOCTYPE html PUBLIC "-//W3C//DTD XHTML 1.0 Transitional//EN" "http://www.w3.org/TR/xhtml1/DTD/xhtml1-transitional.dtd">
<html xmlns="http://www.w3.org/1999/xhtml" >
<head>
<title>Keys and Values</title>
</head>
<body>
<table id="tbl1" cellpadding="0" cellspacing="0" border="0">
<tr>
<td>A</td>
<td>B</td>
<td>C</td>
</tr>
</table>
<script language="javascript" type="text/javascript">
function Car(){
this.Model = "Old Model";
this.getManufactor = new function(){
return "Toyota";
}
}
</script>
</body>
</html>
How-to ~
- Open “Example 1.4′ in firefox
- Open the “console” tab.
- Go to multi-lines commandline by clicking “Larger Command Line” in Option menu
- Write the following code in commandline
var o = new Car();
keys(o);
- You will get the names of all properties of this JS class called “Car”.
Note: If you wanna practice this API, try to get the names of all properties of the HTML table called ‘tbl1′ by using this API. Let me know what result you get. :)
#10. values(object)
Returns an array containing the values of all properties of the object.
Example : Ref: to example 1.4.
How-to ~
- Open “Example 1.4′ in firefox
- Open the “console” tab.
- Go to multi-lines commandline by clicking “Larger Command Line” in Option menu
- Write the following code in commandline
var o = new Car();
<strong>values(o);</strong>
- You will get the values of all properties of this JS class called “Car”.
Note: As the getManufactor of Car() class is a function, it shows “Object” (green link) instead of the value “Toyota”.
#11. debug(fn) and undebug(fu)
Adds or removes a breakpoint on the first line of a function.
Note: I’m not going to cover about this API in this tutorial. Please read more about this in next section.
#12. monitor(functionName) and unmonitor(functionName)
Turns on/off logging for all calls to a function.
Normally, If we want to know whether a particular function is invoked or not, we used to put “alert()”or “console.log()” in that function. It’s too much work if we are working on large script files because we need to find that function in all script files and put “alert()” or “console.log” in that function. and save that file again and run on the browser. With firebug, you don’t need to do those things. You only need to know the function and you can trace how many time that function is invoked. You will get the notification in console when that function that you monitored is invoked. Plus, it will give you a link that is pointing the function in script.
Example 1.5 ~
<!DOCTYPE html PUBLIC "-//W3C//DTD XHTML 1.0 Transitional//EN" "http://www.w3.org/TR/xhtml1/DTD/xhtml1-transitional.dtd">
<html xmlns="http://www.w3.org/1999/xhtml" >
<head>
<title>Monitor and Profiler</title>
<script type="text/javascript">
function func1(){
//doSomething
}
function func2(){
//doSomething
}
function func3(){
//doSomething
}
</script>
</head>
<body>
<input id="btn1" type="button" value="Invoke func1()" onclick="func1();"/>
<input id="btn2" type="button" value="Invoke func2()" onclick="func2();"/>
<input id="btn3" type="button" value="Invoke func3()" onclick="func3();"/>
</body>
</html>
How-to ~
- type “monitor(func1) ” in one-line commandline (wait a few seconds until “>>> monitor(func)” is shown in commandline)
- then, you can click any of those buttons to invoke the function that you like.
- Since we are monitoring the function called “func1()”, we get the link ( check-out the picture below) as a notification whenever you click the button “Invoke func1()”. But you won’t get anything when you click other buttons. This is how the monitor API works in Firebug. You will get the notification when the functions that you are monitoring are invoked.
- Type “unmonitor(func1)” to remove monitoring the func1();
Output ~
#13. monitorEvents(object[, types]) and unmonitorEvents(object[, types])
Turns on/off logging for all events dispatched to an object.
The optional argument “types” may specify a specific family of events to log. The most commonly used values for types are “mouse” and “key”.
The full list of available types includes “composition”, “contextmenu”, “drag”, “focus”, “form”, “key”, “load”, “mouse”, “mutation”, “paint”, “scroll”, “text”, “ui”, and “xul”
Note: Unfortunately, this API doesn’t work propertly. I will contact with Firebug Team and will update about that later. Sorry.
#14. profile([title]) and profileEnd()
Turns on/off the JavaScript profiler. The optional argument title would contain the text to be printed in the header of the profile report.
There are three ways to start Javascript Profiler in Firebug.
Javascript Profiler can be started ~
- by clicking “Profile” button in Console Toolbar.
- by using console.profile(‘My Profiler Title’) from Javascript Code
- by using profile(‘My Profiler Title’) from commandline
If you wanna know more about Javascript Profiler in Firebug, please read my previous tutorial (Firebug Tutorial – Logging, Profiling and CommandLine (Part II)).
Conclusion
This is all about console tab. Even thought it is just a tab, I have to divide my tutorials into three parts (part 1, part 2 and this one). Now, I have covered everything about console tab and its functionalities. I hope you will find it useful.
Don’t hesitate to contact me if you have any suggestion or comment.
Related ~
- Overview of Firebug
- Firebug Tutorial – Logging, Profiling and CommandLine (Part I)
- Firebug Tutorial – Logging, Profiling and CommandLine (Part II)


