nagios 监控
 nagios配置――添加linux主机监控
2011-05-21 22:51:34
标签:nagios 监控主机 linux 休闲 职场

nagios安装请参看:Nginx平台安装Nagios监控服务
下面是我添加linux监控机的过程,如有错误或者不当的地方请指出:
测试环境:
监控主机:nagios+nagios插件+nrpe+网站平台 192.168.1.210
被监控机:nagios插件+nrpe 192.168.1.211
1、首先在监控主机上安装nrpe,nagios只能监控一些外部的信息,例如:ftp端口有没有开放,ssh端口有没有开放,ping值如何之类 的,如果想监控linux主机一些本地的信息如:硬盘使用情况,机器负载等,必须是监控主机通过nagios调用被监控机的nrpe,被监控机的nrpe 搜集信息,然后再返来给监控主机的nagios,这样的一个过程
监控主机安装nrpe:
| tar zxvf nrpe-2.12.tar.gz cd nrpe-2.12 ./configure make all make install-plugin make install-daemon make install-daemon-config |
在被监控机上安装nagios插件和nrpe
| tar zxvf nagios-plugins-1.4.15.tar.gz cd nagios-plugins-1.4.15 ./configure --with-nagios-user=nagios --with-nagios-group=nagios make make install |
安装nrpe的方法与监控主机的nrpe安装方法一样
检查目录及文件:
| ll /usr/local/nagios/libexec |
看看里面是不是有一大堆check的什么东西,如果有就对了
2、配置nagios监控主机的配置文件
nagios的全部配置文件在:/usr/local/nagios/etc目录下面
首先cgi.cfg
refresh_rate=30 #nagios主页的刷新时间,我设置成30秒自动刷新 use_authentication=0 #关闭认证功能,当nagios配置好后,建议开回来 |
这个文件暂时只修改了这两项
然后轮到nagios.cfg
cfg_file=/usr/local/nagios/etc/objects/commands.cfg #nagios可调用的监控命令 |
3、现在可以开始添加被监控机
我们上面定义了所有的主机文件都放在services目录下,那么我们在此目录下新建主机:
vi 192.168.1.211.cfg |
内容如下:
| define host{ use linux-server host_name 192.168.1.211 alias 192.168.1.211 address 192.168.1.211 } define service{ use generic-service host_name 192.168.1.211 service_description check_ping check_command check_ping!100.0,20%!200.0,50% max_check_attempts 5 normal_check_interval 1 } define service{ use generic-service host_name 192.168.1.211 service_description check_ftp check_command check_ftp!21 max_check_attempts 5 normal_check_interval 1 } define service{ use generic-service host_name 192.168.1.211 service_description check_ssh check_command check_ssh max_check_attempts 5 normal_check_interval 1 } define service{ use generic-service host_name 192.168.1.211 service_description check_http check_command check_http max_check_attempts 5 normal_check_interval 1 } |
上面监控了ping值,ftp服务,ssh服务还有http服务,我拿一个例子来说明
| define host{ use linux-server host_name 192.168.1.211 alias 192.168.1.211 address 192.168.1.211 } define service{ use generic-service host_name 192.168.1.211 service_description check_ping check_command check_ping!100.0,20%!200.0,50% max_check_attempts 5 normal_check_interval 1 } |
例如这一段,首先define host定义了这台被监控主机,它所用的模板是linux-server这个,那这个模板又是在哪里定义的呢,就是在刚才nagios里不是有一行模板配置信息吗,就是那个文件,我打开templates.cfg 文件并找到linux-server模板,这模板的信息是这样的:
| define host{ name linux-server ; The name of this host template use generic-host ; This template inherits other values from the generic-host template check_period 24x7 ; By default, Linux hosts are checked round the clock check_interval 5 ; Actively check the host every 5 minutes retry_interval 1 ; Schedule host check retries at 1 minute intervals max_check_attempts 10 ; Check each Linux host 10 times (max) check_command check-host-alive ; Default command to check Linux hosts notification_period workhours ; Linux admins hate to be woken up, so we only notify during the day ; Note that the notification_period variable is being overridden from ; the value that is inherited from the generic-host template! notification_interval 120 ; Resend notifications every 2 hours notification_options d,u,r ; Only send notifications for specific host states contact_groups admins ; Notifications get sent to the admins by default register 0 ; DONT REGISTER THIS DEFINITION - ITS NOT A REAL HOST, JUST A TEMPLATE! } |
这里的信息后面都有说明,把他们拿上谷歌翻译一下便是,
其中check_period 这个是定义监控的时间
check_interval这个是每多少时间执行一次命令
max_check_attempts这个是多少次异常就会报警
这几个便是常用的配置
回到刚才的例子,然后define service就是定义要监控的东西
host_name 就是被监控机的IP
service_description 命令的描述,会在nagios主面上显示
check_command 要执行的命令
max_check_attempts 5 异常多少次会报警
normal_check_interval 1 每1分钟执行一次命令
check_command 这个是根据什么来填写的呢,其实就是根据command.cfg这份配置来填写,打开这份文件找一个ping的命令来看看
| define command{ command_name check_ping command_line $USER1$/check_ping -H $HOSTADDRESS$ -w $ARG1$ -c $ARG2$ -p 5 } |
这份是定义ping命令的配置,很简单,一个名称,然后就是要执行的东西
-w就是警告的值
-c就是严重的值
要看看命令怎么使用很简单
| /usr/local/nagios/libexec/check_ping -H 192.168.1.211 -w 100,20% -c 200,40% |
这样执行下去,可看见返来的信息:
| PING OK - Packet loss = 0%, RTA = 0.54 ms|rta=0.543000ms;100.000000;200.000000;0.000000 pl=0%;20;40;0 |
那么很明显
执行命令是这样的
/usr/local/nagios/libexec/check_ping -H 192.168.1.211 -w 100,20% -c 200,40%
而写在配置文件上是这样的:
check_ping!100.0,20%!200.0,50%
check_ping后面是要跟参数的,在写配置文件的时候参数是要用“!”这个符号来隔开,要注意顺序
明白这个之后,面后都差不多了
现在我们重启nagios来看看效果,养成习惯重启前先检查配置文件有没有错误
| /usr/local/nagios/bin/nagios -v /usr/local/nagios/etc/nagios.cfg |
如果出现如下信息就是正常:
| Total Warnings: 0 Total Errors: 0 |
现在可以安心重启服务了
| service nagios restart |
然后在nagios主页上会看见我们配置的东西出来了:

我的被监控机上没有安装http服务,所以报警了
(未完……太累了睡觉去,明天再写)
回来继续配置!
4、利用nrpe监控linux主机的本地信息
首先是解决nagios怎么去调用nrpe命令,之前我们配置时有说过nagios调用的命令是从command.cfg文件中定义过的,那么要使用nrpe也须要在该文件中定义
| vi command.cfg |
在文件中添加以下配置:
| define command{ command_name check_nrpe command_line $USER1$/check_nrpe -H $HOSTADDRESS$ -c $ARG1$ } |
在添加监控信息之前我们先测试一下监控主机与被监控机的Nrpe的连通性
首先在被监控机上配置允许的监控主机:
| vi nrpe.cfg |
| allowed_hosts=127.0.0.1,192.168.1.210 #添加上我的监控主机的IP |
然后在被监控机上启动nrpe服务:
| /usr/local/nagios/bin/nrpe -c /usr/local/nagios/etc/nrpe.cfg -d |
查看端口是否正常运行:
| [root@localhost ~]# netstat -tunlp | grep nrpe tcp 0 0 0.0.0.0:5666 0.0.0.0:* LISTEN 4304/nrpe |
我们在监控主机上运行一下测试命令看看结果:
| /usr/local/nagios/libexec/check_nrpe -H 192.168.1.211 |
运行这条命令会返回被监控机的nrpe版本信息
| NRPE v2.8.1 |
这样就说明两边的通信没问题!
监控主机的nagios是通过调用被监控机的nrpe来获取信息,那么我们先在被监控机的nrpe配置上添加要搜索的信息,也就是一些命令,然后nagios就通过nrpe调用这些命令来获取信息
这些命令是在nrpe.cfg文件中定义:
| command[check_users]=/usr/local/nagios/libexec/check_users -w 5 -c 10 command[check_load]=/usr/local/nagios/libexec/check_load -w 15,10,5 -c 30,25,20 command[check_sda3]=/usr/local/nagios/libexec/check_disk -w 20 -c 10 -p /dev/sda3 command[check_zombie_procs]=/usr/local/nagios/libexec/check_procs -w 5 -c 10 -s Z command[check_total_procs]=/usr/local/nagios/libexec/check_procs -w 150 -c 200 command[check_swap]=/usr/local/nagios/libexec/check_swap -w 20% -c 10% |
在文件最后我看见有这样一些命令,check_XXX 这个名字是可以自己定义,只要不重复就可以,后面就是你定义的这条命令是调用哪个东西来获取信息,后面跟的这些命令路径不难发现全是在libexec文件 里,我们之前说nagios是调用command.cfg定义的命令,而command.cfg命令也是在libexec里,那么整个流程我们可以看成是 这样:
监控外部信息是这样一个过程:
nagios――command.cfg――libexec
监控一些要登陆了机器才能查看的本地信息侧是这样一个过程:
nagios――command.cfg(check_nrpe)――nrpe.cfg――libexec
在nrpe.cfg文件中定义的几条默认的配置可以直接使用,我们在使用前先测试一下,看看需不需对命令的参数进行一些调整,以符合我们实际情况:
在监控主机上运行:
| /usr/local/nagios/libexec/check_nrpe -H 192.168.1.211 -c check_users |
这条命令会出现这样的信息:
| USERS OK - 3 users currently logged in |users=3;5;10;0 |
如果需要调整参数须在被监控机上做调整,然后我们把这些默认已有的命令添加在我们的被监控机上
在监控主机上编辑我们刚才建立的192.168.1.211.cfg文件,添加信息:
define service{ |
我还需要监控sda1这个分区?我要怎么办?
那么我们先在被监控机的nrpe.cfg上添加:
| command[check_sda1]=/usr/local/nagios/libexec/check_disk -w 20 -c 10 -p /dev/sda1 |
修改完记得重启nrpe服务!重启方法不多说了Kill掉进程,再重新运行就是!
然后在监控主机的192.168.1.211.cfg文件中再添加:
| define service{ use generic-service host_name 192.168.1.211 service_description check_sda1 check_command check_nrpe!check_sda1 max_check_attempts 5 normal_check_interval 1 } |
重启nagios:
| /usr/local/nagios/bin/nagios -v /usr/local/nagios/etc/nagios.cfg service nagios restart |
打开nagios监控主页看看:
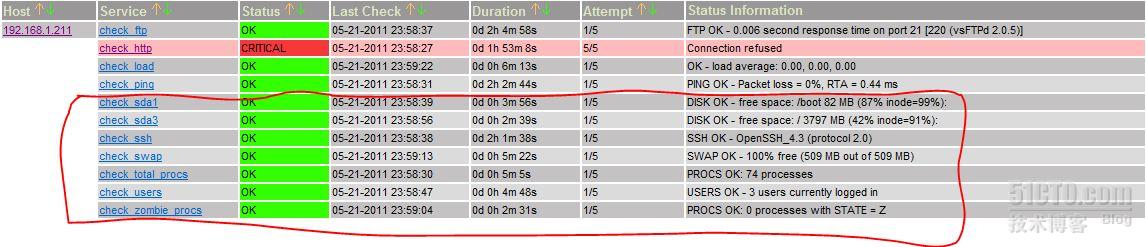
上面就是我们刚才添加的信息,如果还想添加更多的监控,就按照上面的步骤操作就可以,关键是要明白libexec里面的命令怎么使用,这个就要发挥谷歌的作用了。