highcharts 小试
highcharts写了个小例子,怕忘了所以记录下
highcharts 需要jquery.js与highcharts.js
<%@ page language="java" contentType="text/html; charset=UTF-8"
    pageEncoding="UTF-8"%>
<%
String path = request.getContextPath();
System.out.print(path);
String basePath = request.getScheme()+"://"+request.getServerName()+":"+request.getServerPort()+path+"/";
System.out.print(basePath);
%>
<!DOCTYPE html PUBLIC "-//W3C//DTD HTML 4.01 Transitional//EN" "http://www.w3.org/TR/html4/loose.dtd">
<html>
<head>
<base href=" <%=basePath%>">
<meta http-equiv="Content-Type" content="text/html; charset=UTF-8">
<title>Insert title here</title>
<script type="text/javascript"src="asserts/js/jquery.js"></script>
<script type="text/javascript" src="asserts/js/highcharts.js"></script>

<script type="text/javascript">
 $(function(){
	 $.ajax({
		 url: 'test/fruitlist',     //需要去访问后台,获得所需要的数据
			type: 'POST',
			dataType: 'json',
			success: function(data){
				chart(data);	  //得到数据后,传给chart方法展示
		 }
	 });
 });

function chart(data){
		Highcharts.setOptions({
		    global: {
		    	useUTC: false
		  	}
		});
	  var chart1;
		  chart1 = new Highcharts.Chart({
			  chart : {                  //整个图表的整体配置
				  renderTo : 'container',
				  type : 'spline',   //spline 曲线 ,//bar 柱条//line 直线
				  width : 1020,
				  plotBorderColor: 'red',
				  plotBorderWidth: 1,
				  },
			  credits : {        //版权信息   是否显示版权信息(默认显示)
	                           enabled:false
	                           },
	                  title: {   //图表标题相关信息
	                         text: '水果订购情况',
	                         x: -20 //center
	                         },

	                  subtitle: {
	                        text: '2013年'  //副标题
	                        },

			  xAxis : {     //x轴,这里是时间
				      type:"datetime",
				      tickInterval : 16 * 3600 * 1000,
				      dateTimeLabelFormats:
		                                   {
                    		                    second: '%H:%M:%S',
                    		                    minute: '%d. %b %H:%M',
                    		                    hour: '%m-%d %H:%M',
                    		                    day: '%m-%d',
                    		                    week: '%m-%d',
                    		                    month: '%Y-%m',
                    		                    year: '%Y'
		                                   }
				  },
			  yAxis : [
				   {
				     title : {
						 text : '苹果购买率'
					      },
				     labels:{
						formatter:function(){
						     return this.value + "kg";
					         },
				                 style: {
						     color: 'blue'
					         },
				             }

				    },


				 {     // 这里用两个y轴,所以第二个用了  opposite属性
				     title : {
						   text : '橘子购买量'
					      },
				    labels:{
						formatter:function(){
											                                                             return this.value + "kg";
						},
						style: {
						           color: 'red'
						        },

				    },
				    opposite:true
				 }


			          ],

				series:data   //data放需要展示的数据了
		  });

}

</script>
</head>
<body>
     <div id="container" style="width:800px; height: 400px">dfdf</div>
</body>
</html>
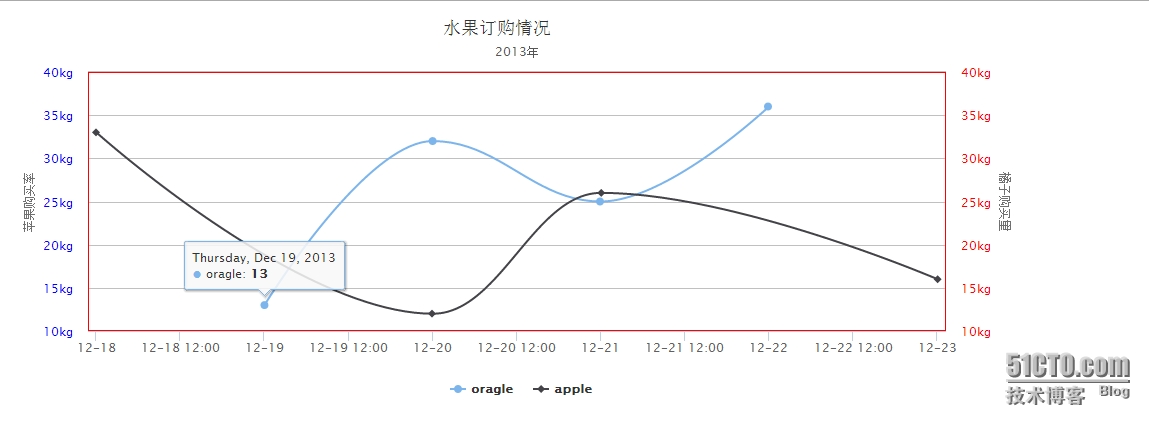
最关键的就是data那部分需要展示的数据了,数据格式为:
[
    {
        "yAxis": 0,
        "name": "oragle",
        "data": [
            [
                1387382400000,    //时间对应的毫秒值
                13
            ],
            [
                1387468800000,
                32
            ],
            [
                1387555200000,
                25
            ],
            [
                1387641600000,
                36
            ]
        ]
    },
    {
        "yAxis": 1,
        "name": "apple",
        "data": [
            [
                1387296060000,
                33
            ],
            [
                1387468920000,
                12
            ],
            [
                1387555380000,
                26
            ],
            [
                1387728240000,
                16
            ]
        ]
    }
]
后台拼接的时候记住,{}是MAP,[]为数组。
因为需要转为json,所以代码还是发出来保留下
	@RequestMapping(value="/test/fruitlist")
	public void handleRequest(HttpServletRequest request,
			HttpServletResponse response) throws Exception {

		String[] result = new String[2];
		SimpleDateFormat sdf = new SimpleDateFormat("yyyy-MM-dd HH:mm");

         Map zhumap = new HashMap();
         zhumap.put("name", "oragle");
         zhumap.put("yAxis", 0);
         List zhulist = new ArrayList();


          List list1 = new ArrayList();
          List list2 = new ArrayList();
          List list3 = new ArrayList();
          List list4 = new ArrayList();
         list1.add(sdf.parse("2013-12-19 00:00").getTime());  list1.add(13);
         list2.add(sdf.parse("2013-12-20 00:00").getTime());  list2.add(32);
         list3.add(sdf.parse("2013-12-21 00:00").getTime());  list3.add(25);
         list4.add(sdf.parse("2013-12-22 00:00").getTime());  list4.add(36);

         zhulist.add(list1);
         zhulist.add(list2);
         zhulist.add(list3);
         zhulist.add(list4);
         zhumap.put("data", zhulist);
         JSONObject json = JSONObject.fromObject(zhumap);
         result[0]=json.toString();


         Map chenmap = new HashMap();
         chenmap.put("name", "apple");
         chenmap.put("yAxis", 1);
         List chenlist = new ArrayList();


         List list5 = new ArrayList();
         List list6 = new ArrayList();
         List list7 = new ArrayList();
         List list8 = new ArrayList();
         list5.add(sdf.parse("2013-12-18 00:01").getTime()); list5.add(33);
         list6.add(sdf.parse("2013-12-20 00:02").getTime());  list6.add(12);
         list7.add(sdf.parse("2013-12-21 00:03").getTime()); list7.add(26);
         list8.add(sdf.parse("2013-12-23 00:04").getTime()); list8.add(16);
         chenlist.add(list5);
         chenlist.add(list6);
         chenlist.add(list7);
         chenlist.add(list8);
         chenmap.put("data", chenlist);
         json = JSONObject.fromObject(chenmap);
         result[1]=json.toString();

		JSONArray resultJson = JSONArray.fromObject(result);
		 response.getWriter().print(resultJson);

		//return new ModelAndView("/welcome",resultJson);
	}
最后图片为:
