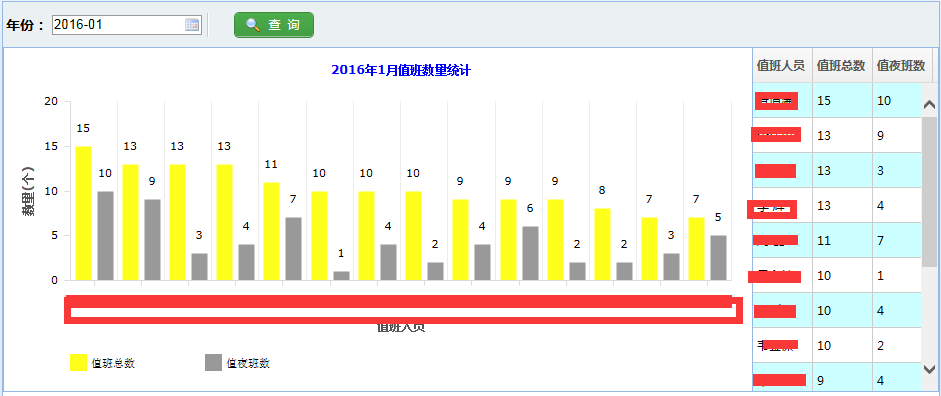
amcharts与easyui datagrid实现值班数量统计
效果:

代码:

代码:
<script>
var chart;
$(function(){
//初始化日期框
//var myDate = new Date(Date.parse(ym.replace(/-/g, "/")));
var year=<%=year%>;
var month=<%=month%>;
if(month<10){
$("#tm").val(year+"-0"+month);
}else{
$("#tm").val(year+"-"+month);
}
//第二部:加载chart数据
loadChart(<%=dscd%>,<%=unitId%>,<%=year%>,<%=month%>);
//chart结束------------------------------------------
//查询
$("#btn").click(function(){
var ym=$("#tm").val();
var year=ym.substring(0,4);
var month=ym.substr(5,2);
loadChart(<%=dscd%>,<%=unitId%>,year,month);
});
//修改文本框(含readOnly)按退格键会触发history.back()的问题
//onfocus="this.blur();"光标无法定位到文本框无法复制内容,需要时可用
$("input[readOnly]").keydown(function(e) {
e.preventDefault();
});
});
//加载chart
function loadChart(dscd,unitId,year,month){
$.messager.progress({
title:'系统提示',
msg:'数据加载中,请稍候...'
});
//chart开始------------------------------------------
//chart准备
chart = new AmCharts.AmSerialChart();
chart.categoryField = "personName";//横坐标
//chart.depth3D = 20;
//chart.angle = 30;
chart.startDuration = 1;
//chart.rotate = true;//柱子方向由左向右//暂时隐藏
// AXES
// category----横坐标
var categoryAxis = chart.categoryAxis;
categoryAxis.axisColor = "#DADADA";
categoryAxis.title = "值班人员";
//categoryAxis.titleRotation=45;
categoryAxis.titleFontSize=12;
categoryAxis.titleColor="#555555";
categoryAxis.dashLength = 1;
categoryAxis.gridPosition = "start";
categoryAxis.equalSpacing = true;
categoryAxis.labelRotation = 0;//旋转度数
// value----纵坐标
var valueAxis = new AmCharts.ValueAxis();
valueAxis.gridColor = "#FFFFFF";
valueAxis.axisColor = "#DADADA";
valueAxis.title = "数量(个)";//y轴坐标
valueAxis.titleColor="#555555";
valueAxis.titleFontSize=12;
valueAxis.titleRotation=45;
valueAxis.dashLength = 1;
chart.addValueAxis(valueAxis);
// GRAPH-1
var graph = new AmCharts.AmGraph();
graph.title="值班总数";
graph.valueField = "dutynum";//y值
//graph.colorField = "color";//动态设置//暂时隐藏
graph.lineColor = ['#FFFF1C','#FFFF1C'];//手动设置渐变色---1
graph.bulletColor = "#FFFFFF";
graph.balloonText = "<span style='font-size:12px;color:#444444'>[[category]]: </span><span style='font-size:12px;color:#BB0E03'><b>[[value]]个班</b></span>";
graph.type = "column";//柱状图
graph.lineAlpha = 0;
graph.fillAlphas = 1;
graph.labelPosition = "top";
graph.labelText = "[[value]]";
graph.labelOffset = 12;
graph.showHandOnHover = true;
chart.addGraph(graph);//添加图形到chart上
// GRAPH-2
var graph2 = new AmCharts.AmGraph();
graph2.title="值夜班数";
graph2.valueField = "eveningdutynum";//y值
// graph2.colorField = "color2";//暂时隐藏
graph2.lineColor = ['#999999', '#999999'];//手动设置渐变色---2
graph2.bulletColor = "#FFFFFF";
graph2.balloonText = "<span style='font-size:12px;color:#444444'>[[category]]: </span><span style='font-size:12px;color:#BB0E03'><b>[[value]]个夜班</b></span>";
graph2.type = "column";//柱状图
graph2.lineAlpha = 0;
graph2.fillAlphas = 1;
graph2.labelPosition = "top";
graph2.labelText = "[[value]]";
graph2.labelOffset = 12;
graph2.showHandOnHover = true;
chart.addGraph(graph2);//添加图形到chart上
// CURSOR
var chartCursor = new AmCharts.ChartCursor();
chartCursor.cursorAlpha = 0;
chartCursor.zoomable = false;
chartCursor.categoryBalloonEnabled = false;
chart.addChartCursor(chartCursor);
chart.creditsPosition = "top-right";
// LEGEND
var legend = new AmCharts.AmLegend();
//legend.useGraphSettings = false;
chart.addLegend(legend);
// WRITE
chart.titleField="title";
//chart.addTitle("月度值班数量统计", 15, '#0000ff', 1, 'border');//暂时隐藏
//chart.addListener("clickGraphItem",queryItem_stat);//点击柱子,grid响应事件//暂时隐藏
chart.write("chartId");
//第一步:渲染chart图形
$('#gridId').datagrid({
//title:"月度值班数量统计(列表展示)",
columns:[[
{field:'personName',title:'<font style="font-size:12px;color:#555555">值班人员</font>',width:60},
{field:'dutynum',title:'<font style="font-size:12px;color:#555555">值班总数</font>',width:60},
{field:'eveningdutynum',title:'<font style="font-size:12px;color:#555555">值夜班数</font>',width:60}
]]
});
//请求数据--------------------
$.post(
sunny.contextPath + '/dutyManage/getStatInfo.do',
{
dscd : dscd,
unitId:unitId,
year:year,
month:month
},
function(result){
$.messager.progress('close');
if(result.length>0){
chart.dataProvider=[];
chart.validateData();
//
chart.dataProvider=result;
if(month<10){
month="0"+month;
}
chart.addTitle(year+"年"+month+"月值班数量统计", 12, '#0000ff', 1, 'border');
chart.validateData();
//加载完图形的同时加载表格数据
loadGrid(result);
}else{
//$.messager.alert('提示', '数据库中没有记录', 'info');
popTipFun("数据库暂无记录!","infoSunnyIcon",2);
chart.dataProvider=[];
chart.validateData();
}
});
}
//柱子点击后
function queryItem_stat(obj){
//alert(obj.item.category);//横坐标值可以取到
//no use
//loadGrid(obj.item.category);
}
//加载grid
function loadGrid(result){
$('#gridId').datagrid({
"onLoadSuccess":function(data){
//$(this).datagrid('selectRow',idx);
},
"rowStyler":function(index,row){
if(index%2==0){
return 'background-color:#ccffff;';
}else{
return 'background-color:#ffffff;';
}
}
}).datagrid("loadData",result);
}
</script>