关于Openlayer3的菜鸟认识
什么是OpenLayers?
OpenLayers 是一个专为Web GIS 客户端开发提供的JavaScript 类库包,用于实现标准格式发布的地图数据访问。从OpenLayers2.2版本以后,OpenLayers已经将所用到的Prototype.js组件 整合到了自身当中,并不断在Prototype.js的基础上完善面向对象的开发,Rico用到地方不多,只是在OpenLayers.Popup.AnchoredBubble类中圆角化DIV。
我眼里的Openlayer:
说到openlayer不得不说其中的map,map是OpenLayers的核心组件,如果把开发openlayer3过程比做画画的话,那么map就是一个神奇的桌子,它是来承载各式各样的纸(layer),画画的背景想用地图做背景怎么办?这个时候ol.layer.Tile出来了,想加载网格中加载块状地图,非它莫属,想加载客户数据怎么办?ol.layer.Vector帮助你,好了背景图有了,自己画的也加上了,突然发现对背景跟自己画的有点不满意,想自己添加,修改怎么办,给map加上特效,ol.interaction.xxxx,想要画点你就加ol,interaction.Draw,想修改你就加上ol.interaction.Modify,当然在加特效之前你可以对地图做一些渲染,ol.FeatureOverlayer,因为默认的样式画出来的东西不一定会看的清。当然事实上远没有这没简单,每个类都有自己的方法。就说map吧,至少我用到最多的是它的on()跟once()方法,前者监听一种特定类型的事件,后者监听一次特定类型的事件,其中on()跟un()是配对使用的。其他的就不多说了,可以参考一下官方手册。
一些常用的例子
首先从Map的官方参考手册看起
ol.Map
The map is the core component of OpenLayers. For a map to render, a view, one or more layers, and a target container are needed.
从上面Map的定义看,我们可以知道map是OpenLayers的核心组件。对map进行渲染,我们至少需要一个view(视图),一个layers(层)和一个目标的容器。
根据定义我们创建一个
最简单的map。
<html>
<head>
<meta charset="utf-8">
<title>GIS开发样例-V1.0</title>
<meta content="Copyright (c) Leetao" name="copyright">
<link rel="stylesheet" href="/jslib/openlayer-3.3.0/css/ol.css" type="text/css">
<script src="/jslib/openlayer-3.3.0/build/ol-debug.js" type="text/javascript"></script>
</head>
<body>
<div id="map" class="map"></div>
<script>
    var map = new ol.Map({
        view: new ol.View({
            center: [0, 0], //视图的初始中心
            zoom: 1        //用于缩放视图的初始分辨率
        }),
        layers: [
        new ol.layer.Tile({  //Tile预渲染层
            source: new ol.source.MapQuest({layer: 'osm'})
        })
        ],
        target: 'map'
    });
</script>
</body>
</html>
结果如图:

简单地图创建结束,接着让我们在地图上画图案
简单的绘图
代码如下:
<html> <head> <meta charset="utf-8"> <title>GIS开发样例-V1.0</title> <meta content="Copyright (c) Leetao" name="copyright"> <link rel="stylesheet" href="/jslib/openlayer-3.3.0/css/ol.css" type="text/css"> <script src="/jslib/openlayer-3.3.0/build/ol-debug.js" type="text/javascript"></script> </head> <body> <div id="map" class="map"></div> <form class="form-inline"> <label>Geometry type </label> <select id="type"> <option value="None">None</option> <option value="Point">Point</option> <option value="LineString">LineString</option> <option value="Polygon">Polygon</option> </select> </form> <script> var source = new ol.source.Vector(); var vector = new ol.layer.Vector({ source: source }); var map = new ol.Map({ view: new ol.View({ center: [0, 0], zoom: 2 }), layers: [ new ol.layer.Tile({ source: new ol.source.MapQuest({layer: 'osm'}) }) // vector //(2) ], target: 'map' }); //featureOverlay var featureOverlay = new ol.FeatureOverlay({ style: new ol.style.Style({ fill: new ol.style.Fill({ color: 'rgba(255, 255, 255, 0.2)' }), stroke: new ol.style.Stroke({ color: '#ffcc33', width: 2 }), image: new ol.style.Circle({ radius: 7, fill: new ol.style.Fill({ color: '#ffcc33' }) }) }), } ); featureOverlay.setMap(map); var typeSelect = document.getElementById('type'); var draw; function addInteraction() { var value = typeSelect.value; if (value !== 'None') { draw = new ol.interaction.Draw({ features: featureOverlay.getFeatures(), // (1) source: source, type: /** @type {ol.geom.GeometryType} */ (value) }); map.addInteraction(draw); } } typeSelect.onchange = function(e) { map.removeInteraction(draw); addInteraction(); }; addInteraction(); </script> </body> </html>
结果如下:

上面代码可以让你在Tile上绘点,线以及几何图形,当然如果你把
(1)注释了,再尝试在上面绘点,你会发现绘制的图形变成透明的了,
如果你先把(2)注释给取消了,在把(1)给注释了,你会发现,这个时候绘图是可以看见的
绘图结束了就是该修改图了
简单的绘图以及修改图
只需要在原有基础上加个
ol.interaction.Modify就可以修改了
代码如下:


<html> <head> <meta charset="utf-8"> <title>GIS开发样例-V2.0</title> <meta content="Copyright (c) Leetao" name="copyright"> <link rel="stylesheet" href="/jslib/openlayer-3.3.0/css/ol.css" type="text/css"> <script src="/jslib/openlayer-3.3.0/build/ol-debug.js" type="text/javascript"></script> </head> <body> <div id="map" class="map"></div> <form class="form-inline"> <label>Geometry type </label> <select id="type"> <option value="None">None</option> <option value="Point">Point</option> <option value="LineString">LineString</option> <option value="Polygon">Polygon</option> </select> </form> <script> var source = new ol.source.Vector(); var vector = new ol.layer.Vector({ source: source }); var map = new ol.Map({ view: new ol.View({ center: [0, 0], zoom: 2 }), layers: [ new ol.layer.Tile({ source: new ol.source.MapQuest({layer: 'osm'}) }) ], target: 'map' }); //featureOverlay var featureOverlay = new ol.FeatureOverlay({ style: new ol.style.Style({ fill: new ol.style.Fill({ color: 'rgba(255, 255, 255, 0.2)' }), stroke: new ol.style.Stroke({ color: '#ffcc33', width: 2 }), image: new ol.style.Circle({ radius: 7, fill: new ol.style.Fill({ color: '#ffcc33' }) }) }), } ); featureOverlay.setMap(map); var modify = new ol.interaction.Modify({ features: featureOverlay.getFeatures(), deleteCondition: function(event) { return ol.events.condition.shiftKeyOnly(event) && ol.events.condition.singleClick(event); } }); map.addInteraction(modify); var typeSelect = document.getElementById('type'); var draw; // global so we can remove it later function addInteraction() { var value = typeSelect.value; if (value !== 'None') { draw = new ol.interaction.Draw({ features: featureOverlay.getFeatures(), source: source, type: /** @type {ol.geom.GeometryType} */ (value) }); map.addInteraction(draw); } } typeSelect.onchange = function(e) { map.removeInteraction(draw); addInteraction(); }; addInteraction(); </script> </body> </html>
当然可以添加特效也可以修改特效,采用map.removeInteraction(),可以在特定事件触发之后禁止修改亦或是禁止绘图
上面都是单层的,如果想加入客户数据,参照样例一,将注释(2)去掉即可。
现在我们尝试从后台加载数据,并对后台传来的数据进行二次修改
修改后台传来的数据
主要采用了ol.interaction.Select()方法
核心代码如下:
var raster = new ol.layer.Tile({
  source: new ol.source.MapQuest({
    layer: 'sat'
  })
});
var vector = new ol.layer.Vector({
  source: new ol.source.GeoJSON({
    projection: 'EPSG:3857',
    url: 'data/geojson/countries.geojson'
  })
});
var select = new ol.interaction.Select();
var modify = new ol.interaction.Modify({
  features: select.getFeatures()
});
var map = new ol.Map({
  interactions: ol.interaction.defaults().extend([select, modify]),
  layers: [raster, vector],
  target: 'map',
  view: new ol.View({
    center: [0, 0],
    zoom: 2
  })
});
其中ol.interaction.Select是用来处理被选中的Vector的数据的。
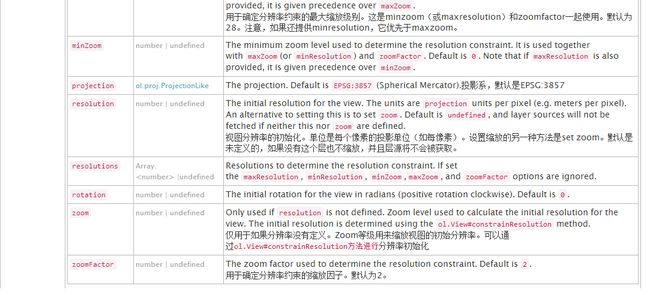
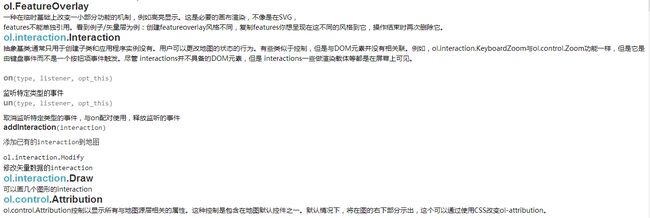
最后附上官方手册部分翻译(博主自己翻译的,可能有错,只供参考)
如果文章存在错误,请指正。