数字调制的误比特率
注:更新于2015/08/02,增加了博文打赏,见文章结束后的二维码。如果您觉得此博文帮助了您,愿意打赏,请您阅读博文一个艰难的决定 ,了解为何添加博文打赏。
一晃就到了2012年了,之前在通信人家园水了很长一段时间,也曾萌发把博客搬移到C114上去,毕竟那里才是通信的中心,而CSDN是计算机的圣地。但是,又一想自己写博客的目的主要还是为了自己以后能寻找到当初的思维过程,而不是过多其他什么的,就像博客的名字一样---找寻最初的美:我能循着这一篇篇过往的文章,找寻到当初那些给我带来写作冲动抑或是技术上的那一抹美丽,就心满意足了。所以,最后还是坚持在CSDN上继续下去,虽然它很多时候登不上去,虽然它闹出了密码门事件,但是看着过去的文章,竟有一种不忍割舍的情怀。
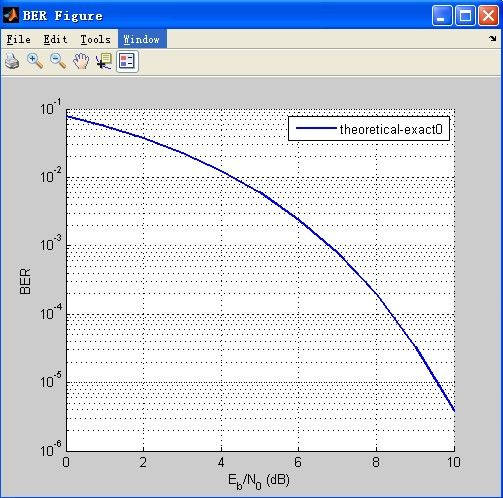
好了,言归正传,今天记录一下简单的数字调制的误比特率,首先,我们看看常见的数字调制方式的BER情况,如下图所示:
这些函数的图像其实在matlab里有GUI来方便的绘制,只需打开bertool(在命令行直接输入bertool),在里面有选择Thereotical的tab就行啦,然后你可以方便的选择各种参数,设置好后plot就行!如图:
所以,这些有用的曲线非常容易获得,但也得说明的是,并不是所有的调制都有closed-form函数表达式的。
好了,毕竟上面都是理论的曲线,我们要做的就是实际的仿真下,看看是不是与理论曲线吻合的。我们直接研究QPSK吧,这里面有些需要注意的地方,直接上代码吧。如下:
%simulation of the  QPSK
%Channel: AWGN  or Rayleigh fading
%Version 1.0 by ZXY
%data:2012.2.4

%NOTE: the reason for this simulation is that:
% 1:we know the BER for QPSK and BPSK is the same with the same value
%    of Eb/N0
% 2:we would like to do some investigation in the relation between Eb/N0 and SNR.


clear all
close all

ns = 1000; %number of data for one loop
loop = 100000; %we will simulate 10000 times to generate 'enough' errors
ebn0 = 0:1:10; %the parameter of Eb/N0
h1 = modem.pskmod('M',4,'SymbolOrder','Gray','InputType','Bit'); %to make it simple ,wo use build-in function to accomplish this task
h2 = modem.pskdemod('M',4,'SymbolOrder','Gray','OutputType','Bit');
h11 = modem.pskmod('M',4,'InputType','Bit');
h22 = modem.pskdemod('M',4,'OutputType','Bit');
tic  % start the counter of time
for i = 1:length(ebn0)  %outer loop for --each value of Eb/N0
 error = 0;  % for each Eb/N0,first,set number of errors to be ZERO.
 for iii=1:loop %inner loop : for each Eb/N0,we do simulation for <loop> times,ie--10000
     data = randint(1,ns)'; %generate the source data
     tx1 = modulate(h1,data); %modulate by using build-in function
     %To simulate Rayleigh Channel
     x=randn(1,ns);
     y=randn(1,ns);
     r=sqrt(0.5*(x.^2+y.^2));%r is a Rayleigh distribution
     %go through fading channel
     %tx = tx1.*r;
     %------------
     %Es/N0 = Eb/N0 + 10log10(k),k is the number of useful information bits
     %  per symbol
     %Es/N0 = snr + 10log10(m),m is the ratio between the period of symbol
     %  and the sampling
     %------------
     %for QPSK ,we set m=1 and we know that k is 2
     snr = ebn0(i) +10*log10(2);
     ynoisy = awgn(tx1,snr,'measured');% for 'awgn' function,we shoule use the SNR parameter
     yrx = ynoisy;%contaminated signal
     zsym = demodulate(h2,yrx);%demodulate
     [number_of_errors,bit_error_rate] = biterr(data,zsym);%calculate the number of errors
     error = error + number_of_errors;%counter for the total errors
     %if we obtain enough errors,then,we stop the inner loop
     if(error>100)
         break
     end

 end
 BER(i) = error/(iii*1000);%calculate the BER

end
toc%stop time counter
EbN0_in_db=0:10;EbN0=10.^(EbN0_in_db/10);
%pe=0.5*erfc(sqrt(EbN0));%theoretical curve
theoretical_ber = berawgn(EbN0_in_db,'psk',4,'nondiff');
semilogy(EbN0_in_db,theoretical_ber,'g')
hold on;%plot
semilogy(ebn0,BER,'k*')
grid
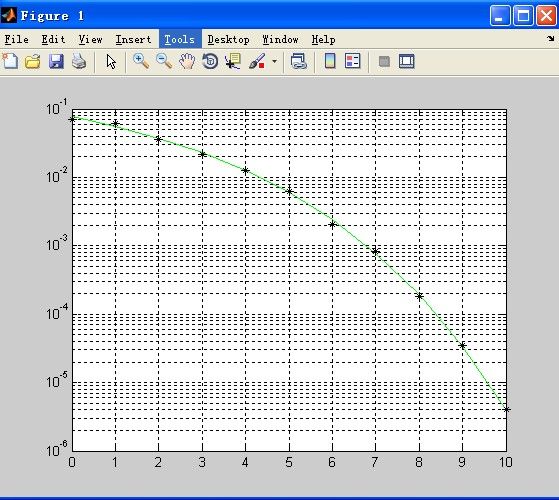
得到的结果如图所示:
同时在命令窗口得到如下提示:Elapsed time is 69.223151 seconds.说明整个仿真用时接近70秒。
重点是下面几点:
1)为了保证足够的可靠度,我们对于每个En/N0的值都要收集到100个errors或者要仿真ns*loop=1e8个数据才停止。
从理论上讲这已经算比较可靠的方式了。因为在bertool的Monte Carlo的tab内也有相应的设置:Number of errors 和Number of bits这两项,而它们的默认值就是100 和1e8
2)通过仿真我们发现,所有的这些理论曲线有一个共同的基础,那就是:它们都默认采用了Gray映射的星座图。这点在matlab的berawgn()函数中有特别说明,所以当你发现自己的程序没有逻辑错误但是总是与理论曲线不吻合,就可以考虑是不是星座映射的问题了。
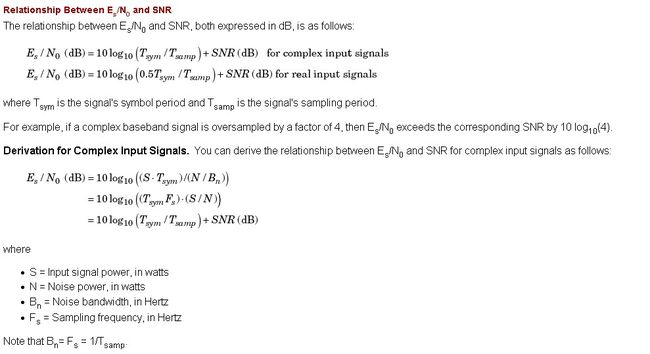
3)也是最重要的一点,通常的理论曲线都是BER-EbN0之间的,而我们的加噪函数往往需要的SNR的值,那么我们都需要转换,转换关系根据matlab的帮助文件里说明如下:
后记:多读matlab自带的帮助文件还是挺有用的!
我的支付宝


