Success Rate of iBots in OBIEE
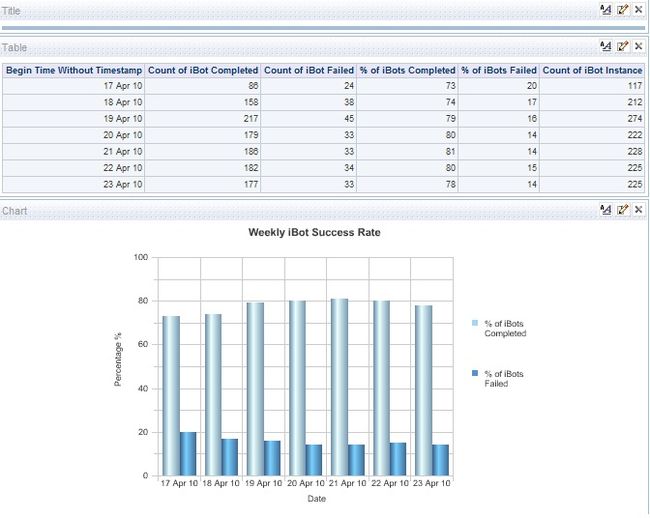
One of my client had a requirement to see the weekly trend on iBot Success Rate.
Prior to this I had never worked on iBots. So it took some time for me to first explore on iBots Configuration.
The best site to refer for Scheduler Configuration is VenkatKrishnan’s blog.
http://oraclebizint.wordpress.com/2007/09/13/oracle-bi-ee-10133-configuring-delivers-ibots/
So I am not gonna tell you about Scheduler Configuration and all.
Rather, I will focus on the uses of those Scheduler tables to get the success rate of iBots.
Basically there are four tables related to Scheduler Configuration:
S_NQ_JOB : Whenever you create an iBot, a new record is created in this table with a unique Job Id.
S_NQ_INSTANCE : You can schedule an iBot to run n number of times. So whenever an iBot is run, a new instance is created in this table with unique Instance Id but the Job Id would be same.
S_NQ_JOB_PARAM: This table stores Job parameters related to each iBot.
S_NQ_ERR_MSG: All the error messages related to iBots gets stored in this table.
Now import all these tables in rpd. Create physical joins as follows:
S_NQ_JOB.JOB_ID = S_NQ_INSTANCE.JOB_ID
S_NQ_ERR_MSG.JOB_ID = S_NQ_INSTANCE.JOB_ID
S_NQ_JOB_PARAM.JOB_ID = S_NQ_INSTANCE.JOB_ID
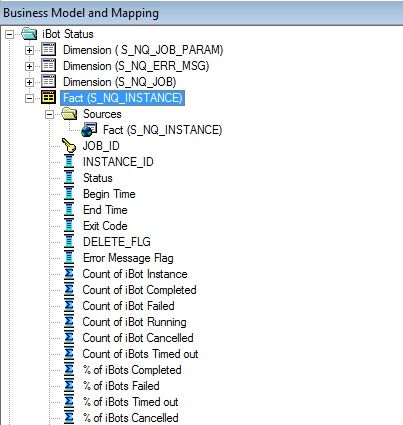
Now, in the BMM layer drag all these tables together and create logical columns in Fact with an aggregation of count.
Count of iBots Completed : CASE WHEN S_NQ_INSTANCE.STATUS =0 THEN S_NQ_INSTANCE.INSTANCE_ID
Count of iBots Failed : CASE WHEN S_NQ_INSTANCE.STATUS = 2 THEN S_NQ_INSTANCE.INSTANCE_ID
Count of iBots Running : CASE WHEN S_NQ_INSTANCE.STATUS = 1 THEN S_NQ_INSTANCE.INSTANCE_ID
Count of iBots Timed out : CASE WHEN S_NQ_INSTANCE.STATUS = 5 THEN S_NQ_INSTANCE.INSTANCE_ID
Count of iBots Cancelled : CASE WHEN S_NQ_INSTANCE.STATUS = 3 THEN S_NQ_INSTANCE.INSTANCE_ID
Count of iBots Instance : INSTANCE_ID
% of iBots Completed : Count of iBots Completed/Count of iBots Instance *100
% of iBots Failed : Count of iBots Failed/Count of iBots Instance *100
and so on for % of iBots Running, Cancelled and Timed Out.

Drag all the Logical tables in Presentation layer, check for consistency, save and load the repository.
Now, log in to the presentation services and create the report.
