FusionCharts破解版导出图片步骤
1,加入jar包(fcexporter.jar ;fcexporthandler.jar ),FCExporter.swf,FusionChartsExportComponent.js
2,拷贝文件FCExporter.php到
WebContent/jsp/ExportHandlers/PHP/FCExporter.php
3,web.xml加入servlet
	<servlet>
		<display-name>FCExporter</display-name>
		<servlet-name>FCExporter</servlet-name>
		<servlet-class>com.fusioncharts.exporter.servlet.FCExporter</servlet-class>
		<load-on-startup>1</load-on-startup>
	</servlet>
	<servlet-mapping>
		<servlet-name>FCExporter</servlet-name>
		<url-pattern>/jsp/ExportHandlers/PHP/FCExporter</url-pattern>
	</servlet-mapping>
servlet的url-pattern和上面的文件FCExporter.php路径要一致,去掉后缀.php
4,加入配置文件fusioncharts_export.properties,放在claess路径下(最后到工程的WEB-INF\classes下就对了,里面的属性自己看着改)
#Please specify the path to a folder with write permissions relative to web application root
#SAVEPATH=./tempphoto/
SAVEPATH=./tempExport/
#Please specify the path to a folder with write permissions relative to web application root
#the folder where exported charts will be saved.
#the folder where exported charts will be saved.
#in this constant e.g., http://www.yourdomain.com/images/
#HTTP_URI=http://lsy.helpdesk.citicsinfo.com/tempphoto/
HTTP_URI=http://lsy.helpdesk.citicsinfo.com/tempExport/
#OVERWRITEFILE sets whether the export handler will overwrite an existing file
#the newly created exported file. If it is set to false the export handler will
#not overwrite. In this case if INTELLIGENTFILENAMING is set to true the handler
#will add a suffix to the new file name. The suffix is a randomly generated UUID.
#Additionally, you can add a timestamp or random number as additional prefix.
OVERWRITEFILE=false
INTELLIGENTFILENAMING=true
FILESUFFIXFORMAT=TIMESTAMP
5,在报表的xml数据中药加入几个属性。
' exportEnabled="1" exportAtClient="0" exportAction="save"'
' exportHandler="http://lsy.helpdesk.citicsinfo.com/jsp/ExportHandlers/PHP/FCExporter"'
' exportCallback="myCallBackFunction" '
其中exportHandler="http://lsy.helpdesk.citicsinfo.com/jsp/ExportHandlers/PHP/FCExporter
是你刚才注册的servlet的请求路径,比如http://xxx:8080/aaa,这里我完整的请求就是上面的路径。
例子:
var dataString11 ='<chart caption="呼入总数 " palette="2" xAxisName="" '
	+'yAxisName="单位:个" formatNumberScale="0" numberPrefix="" '
	+'labeldisplay="ROTATE" slantLabels="1" sNumberSuffix=" pcs." showLabels="1" '
	+'showValues="1" '
	+' exportEnabled="1" exportAtClient="0" exportAction="save"'
	+' exportHandler="http://lsy.helpdesk.citicsinfo.com/jsp/ExportHandlers/PHP/FCExporter"'
	+' exportCallback="myCallBackFunction" '
	+'labelDisplay="STAGGER">\n\
	<set label="11" value="11" />\n\
	<styles>\n\
	<definition><style type="font" name="CaptionFont" size="15" color="666666" />\n\
	<style type="font" name="SubCaptionFont" bold="0" />\n\
	</definition><application>\n\
	<apply toObject="caption" styles="CaptionFont" />\n\
	<apply toObject="SubCaption" styles="SubCaptionFont" />\n\
	</application>\n\
	</styles>\n\
	</chart>';
var dataString12 ='<chart caption="呼入总数 222" palette="2" xAxisName="" '
	+'yAxisName="单位:个" formatNumberScale="0" numberPrefix="" '
	+'labeldisplay="ROTATE" slantLabels="1" sNumberSuffix=" pcs." showLabels="1" '
	+'showValues="1" '
	+' exportEnabled="1" exportAtClient="0" exportAction="save"'
	+' exportHandler="http://lsy.helpdesk.citicsinfo.com/jsp/ExportHandlers/PHP/FCExporter"'
	+' exportCallback="myCallBackFunction" '
	+'labelDisplay="STAGGER">\n\
	<set label="11" value="11" />\n\
	<styles>\n\
	<definition><style type="font" name="CaptionFont" size="15" color="666666" />\n\
	<style type="font" name="SubCaptionFont" bold="0" />\n\
	</definition><application>\n\
	<apply toObject="caption" styles="CaptionFont" />\n\
	<apply toObject="SubCaption" styles="SubCaptionFont" />\n\
	</application>\n\
	</styles>\n\
	</chart>';
6,页面调用。
<html>
<%@ page language="java" contentType="text/html; charset=UTF-8"%>
<%@ taglib uri="/struts-tags" prefix="s"%>
<%@ page import="java.util.*" %>
<%@ page import="java.io.*" %>
<%
	String path = request.getContextPath();
%>

<head>
<meta http-equiv="Content-Type" content="text/html; charset=UTF-8" />
     <title>Single Series Column 2D Chart</title>
<script src="<%=path%>/script/jquery-1.7.1.js" type="text/javascript"></script>
<link href="<%=path%>/resource/hd/css/style2.css" rel="stylesheet" type="text/css" />


<link href="<%=path%>/script/plugin/FusionCharts_Evaluation/Gallery/assets/ui/css/style.css" rel="stylesheet" type="text/css" />
<link href="<%=path%>/script/plugin/FusionCharts_Evaluation/Gallery/assets/prettify/prettify.css" rel="stylesheet" type="text/css" />

<script type="text/javascript" src="<%=path%>/script/plugin/FusionCharts_Evaluation/Charts/FusionCharts.js"></script>
<script type="text/javascript" src="<%=path%>/script/plugin/FusionCharts_Evaluation/Gallery/assets/ui/js/json2.js"></script>
<script type="text/javascript" src="<%=path%>/script/plugin/FusionCharts_Evaluation/Gallery/assets/prettify/prettify.js"></script>
<script type="text/javascript" src="<%=path%>/script/plugin/FusionCharts_Evaluation/Gallery/assets/ui/js/lib.js" ></script>
<script type="text/javascript" src="<%=path%>/script/plugin/FusionCharts_Evaluation/Charts/FusionChartsExportComponent.js" ></script>

<script src="<%=path%>/script/plugin/My97DatePicker/WdatePicker.js" type="text/javascript"></script>

<script src="<%=path%>/resource/tool/hometab/Style/menu.js" type="text/javascript"></script>
<link rel="stylesheet" href="<%=path%>/resource/tool/hometab/Style/default.css" type="text/css" />
<script src="<%=path%>/script/hd/greenpage.js" type="text/javascript"></script>
<link rel="stylesheet" href="<%=path%>/script/hd/greenpage.css" type="text/css" />


<script type="text/javascript" src="<%=path%>/script/hd/greenpage.js"></script>
<link href="<%=path%>/script/hd/greenpage.css" rel="stylesheet" type="text/css" />


</head>

<body style=" overflow-y:scroll;">
<input type="hidden" id="path" value="<%=path%>" />

<div style="width:100%;height:10px"></div>
<h3 style="text-align: center;vertical-align:bottom;padding: 0px,0px,5px,0px; margin: 0px,0px,5px,0px; font-size:14px;color: #0c212b; ">
报表系统--呼入汇总</h3>

<div style="width:100%;"></div>
<div id="fcexpDiv" style="display:none;"  align="center">FusionCharts Export Handler Component</div>
<input type="button" value="sss" onclick="ffgg()"/>

        <table  style="width:100%;align:center" border="0px" align="center">
           <tr>
              <td style="width:100%;align:center">
               <div id="chartdiv11" style="align:center" align="center"></div>
              </td>
              <td style="width:100%;align:center">
               <div id="chartdiv12" style="align:center" align="center"></div>
              </td>
           </tr>
        </table>


    </body>
 </html>
   <script type="text/javascript" src="temp/insum333.js" ></script>

<script type="text/javascript">
var path=document.getElementById("path").value;

if (GALLERY_RENDERER && GALLERY_RENDERER.search(/javascript|flash/i)==0)  FusionCharts.setCurrentRenderer(GALLERY_RENDERER);


var chart11 = new FusionCharts("<%=path%>/script/plugin/FusionCharts_Evaluation/Charts/Column3D.swf", "ChartId11", "700", "400", "0", "0");
chart11.setXMLData(dataString11);
chart11.render("chartdiv11");

var chart12 = new FusionCharts("<%=path%>/script/plugin/FusionCharts_Evaluation/Charts/Column3D.swf", "ChartId12", "700", "400", "0", "0");
chart12.setXMLData(dataString12);
chart12.render("chartdiv12");


function myCallBackFunction(objRtn){
	if (objRtn.statusCode=="1"){
		alert("Haha!The chart was successfully saved on server. The file can be accessed from " + objRtn.fileName);
	}else{
		alert("Oh.The chart could not be saved on server. There was an error. Description : " + objRtn.statusMessage);
	}

}
/*
function FC_Exported(objRtn){
	if (objRtn.statusCode=="1"){
		alert("FC_Exported--The chart was successfully saved on server. The file can be accessed from " + objRtn.fileName);
	}else{
		alert("FC_Exported--The chart could not be saved on server. There was an error. Description : " + objRtn.statusMessage);
	}

}
*/
function ffgg(){
	var myExportComponent = new FusionChartsExportObject("fcExporter1", "../../../../script/plugin/FusionCharts_Evaluation/Charts/FCExporter.swf");

	//myExportComponent.sourceCharts = ['myChartId1','myChartId2','myChartId3'];
	myExportComponent.sourceCharts = ['ChartId11','ChartId12'];
	myExportComponent.componentAttributes.fullMode='1';
	myExportComponent.componentAttributes.saveMode='both';
	myExportComponent.componentAttributes.showAllowedTypes='0';
  //myExportComponent.componentAttributes.showAllowedTypes='1';
	myExportComponent.componentAttributes.width = '350';
	myExportComponent.componentAttributes.height = '140';
	myExportComponent.componentAttributes.showMessage = '1';
	myExportComponent.componentAttributes.message = 'Click on button above to begin export of charts. Then save from here.';
	myExportComponent.componentAttributes.defaultExportFileName = 'MyCharts';
	myExportComponent.componentAttributes.defaultExportFormat='JPG';// JPG, PNG or PDF


	myExportComponent.Render("fcexpDiv");

	myExportComponent.BeginExport();


}
</script>
看着挺多挺乱的。
其实有3点要说明。
<div id="fcexpDiv" style="display:none;" align="center">FusionCharts Export Handler Component</div>
这个div是到处时需要用的,方便用户选择导出选项,可以通过showAllowedTypes设置,我直接使用
style="display:none;"隐藏掉了。
还有每导出一张图片,servlet会调一次回调函数
function myCallBackFunction(objRtn){
if (objRtn.statusCode=="1"){
alert("Haha!The chart was successfully saved on server. The file can be accessed from " + objRtn.fileName);
}else{
alert("Oh.The chart could not be saved on server. There was an error. Description : " + objRtn.statusMessage);
}
}
最后就是导出的调用方法和一些参数设置,这样调用
function ffgg(){
var myExportComponent = new FusionChartsExportObject("fcExporter1", "../../../../script/plugin/FusionCharts_Evaluation/Charts/FCExporter.swf");
//myExportComponent.sourceCharts = ['myChartId1','myChartId2','myChartId3'];
myExportComponent.sourceCharts = ['ChartId11','ChartId12'];
myExportComponent.componentAttributes.fullMode='1';
myExportComponent.componentAttributes.saveMode='both';
myExportComponent.componentAttributes.showAllowedTypes='0';
//myExportComponent.componentAttributes.showAllowedTypes='1';
myExportComponent.componentAttributes.width = '350';
myExportComponent.componentAttributes.height = '140';
myExportComponent.componentAttributes.showMessage = '1';
myExportComponent.componentAttributes.message = 'Click on button above to begin export of charts. Then save from here.';
myExportComponent.componentAttributes.defaultExportFileName = 'MyCharts';
myExportComponent.componentAttributes.defaultExportFormat='JPG';// JPG, PNG or PDF
myExportComponent.Render("fcexpDiv");
myExportComponent.BeginExport();
}
具体参数什么意思,查文档吧,里面说的很全很详细。
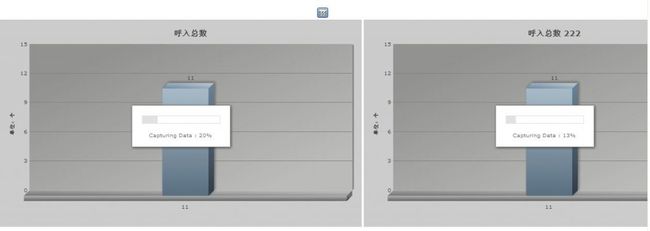
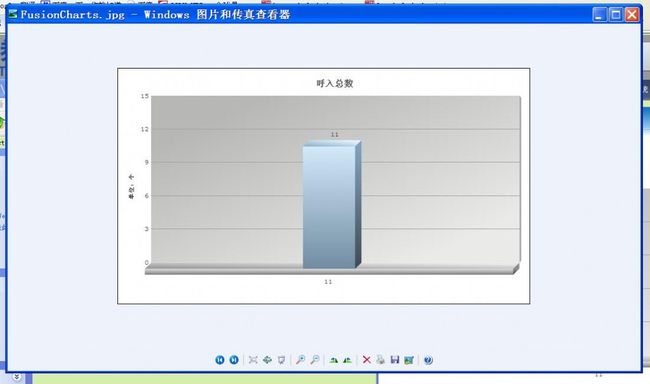
过程截图:
这样图片就完成了导出。在服务器路径下,你可以找到图片然后进行其他操作。
还有个小问题,就是批量导出时,图片的名字不可设置,是随机生成的,而且多张图片到处时,
没有先后顺序,这样最后生成的图片没法和页面对应,我们拿到这几张图片是无序的,处理起来
没法辨认顺序。我想到一个办法就是每张报表chart都有一个独立的文件夹在服务器下,生成报表图片后,
即使是无序的文件名,我也会让程序按照页面上对应的顺序去服务器下找图片,这样貌似有些麻烦,不失为一个解决途径。


