回归算法(最小二乘法拟合)
回归算法原理
根据测量数据来分析变量之间相互关系的方法称为回归分析法,即工程上所说的拟合问题,所得的关系式即为经验公式或拟合方程。根据变量个数及变量之间关系的不同,回归分析分为一元线性回归(直线拟合)、一元非线性回归(曲线拟合)、多元线性回归和多项式回归等。
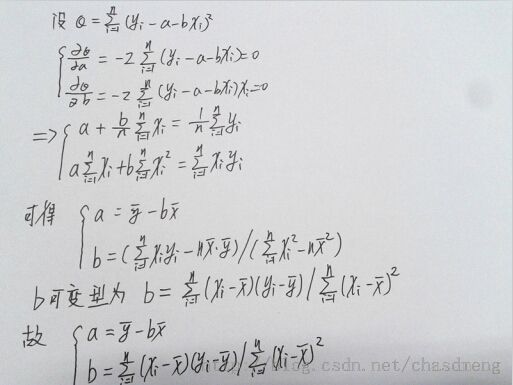
最常见的拟合方法是最小二乘法。最小二乘法的出发点是使实际测量数据yi与拟合直线上对应的估计值的残差的平方和为最小。即
对于最简单情况:一元线性拟合 y=a+bx,根据最小二乘法有
为使公式(1.2)最小只需要对其求a、b偏导,然后令偏导数等于0即可就出a、b值:
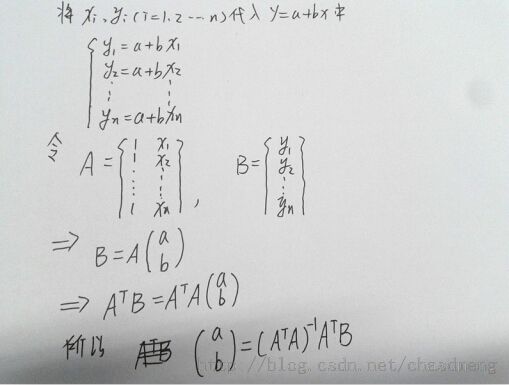
同样可使通过矩阵的方式求解a、b值:
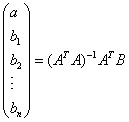
对于多元线性回归、多元非线性回归都可以转换成线性回归方式求解,而使用矩阵方式得到的结果更利于泛化。当时多元回归模型时,对应的系数矩阵(a,b1,b2,b3,.....bn)同样可使是用上面的求解表示。
算法实现(Python版)
一、一元线性回归
import matplotlib.pyplot as plt
x =[1,2,3,5,6,12,11,13]
y =[4,5,8,13,12,23,20,22]
average_x=float(sum(x))//len(x)
average_y=float(sum(y))/len(y)
x_sub=map((lambda x:x-average_x),x)
y_sub=map((lambda x:x-average_y),y)
x_sub_pow2=map((lambda x:x**2),x_sub)
y_sub_pow2=map((lambda x:x**2),y_sub)
x_y=map((lambda x,y:x*y),x_sub,y_sub)
a=float(sum(x_y))/sum(x_sub_pow2)
b=average_y-a*average_x
plt.xlabel('X')
plt.ylabel('Y')
plt.plot(x, y, '*')
plt.plot([0,15],[0*a+b,15*a+b])
plt.grid()
plt.show()
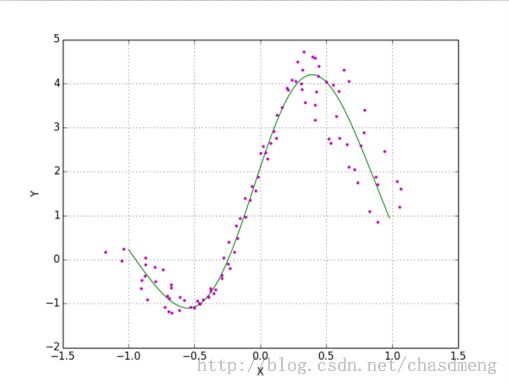
二、多元回归
from numpy import *
from random import *
import matplotlib.pyplot as plt
def Data():
    x = arange(-1,1,0.02)
    y = ((x*x-1)**2+2)*(sin(x*3)+0.7*cos(x*1.2))
    xr=[];yr=[];i = 0
    for xx in x:
        yy=y[i]
        d=float(randint(80,120))/100
        i+=1
        xr.append(xx*d)
        yr.append(yy*d)
    return x,y,xr,yr
def MAT(x,y,order):
    X=[]
    for i in range(order+1):
        X.append(x**i)
    X=mat(X).T
    Y=array(y).reshape((len(y),1))
    return X,Y
def fig(x1,y1,x2,y2):
    plt.xlabel('X')
    plt.ylabel('Y')
    plt.plot(x1,y1,color='g',linestyle='-',marker='')
    plt.plot(x2,y2,color='m',linestyle='',marker='.')
    plt.grid()
    plt.show()
def Solve():
    x,y,xr,yr = Data()
    X,Y = MAT(x,y,9)
    XT=X.transpose()
    B=dot(dot(linalg.inv(dot(XT,X)),XT),Y)
    myY=dot(X,B)
    fig(x,myY,xr,yr)
Solve()


