Silverlight图表控件(二)
kagula
2011-10-30
内容简介
在《Silverlight图表控件》文章的基础上,进一步以源码的形式展示如何进一步定制化Silverlight图表控件。
代码很多地方懒的注释了(因为我每天很忙),本文假设你已经读过我写的《Silverlight图表控件》,并有C#基础。
本文的代码调试环境参考《Silverlight图表控件》。
本文包括两个例子:
第一个例子,如何自定义矩形的颜色。
第二个例子在第一个例子的基础上,展示了,在上一种数据源,如何添加一种颜色信息,又不和原来的颜色信息(源数据源)不冲突。
根据例一和例二的源代码你可以很容易展示同一数据源的两种不同数据可视化的表达。
每个例子包括四部份内容:
[1]App.xaml中的代码主要功能:可视化风格的定义。
[2]MainPage.xaml中的代码的主要功能:控件位置的摆放,和控件属性的设定。
[3]MainPage.xaml.cs中的代码的主要功能:产生数据源,数据源同控件的绑定,子控件的添加,控件属性的设定。
[4]辅助代码,例如记录结构的定义等等。
正文
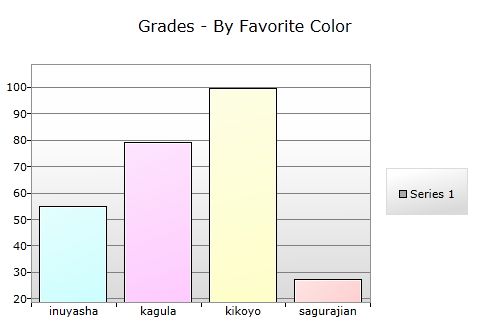
例一:根据不同的学生显示不同颜色的矩形条,不同矩形条的高代表了不同学生的成绩;
第一步:新建Silverlight4 应用项目,修改App.xaml的代码如下
<Application xmlns="http://schemas.microsoft.com/winfx/2006/xaml/presentation"
             xmlns:x="http://schemas.microsoft.com/winfx/2006/xaml"
             xmlns:charting="clr-namespace:System.Windows.Controls.DataVisualization.Charting;assembly=System.Windows.Controls.DataVisualization.Toolkit"
             x:Class="testChart3.App"
             >
    <Application.Resources>
        <Style x:Key="ColorByPreferenceColumn" TargetType="charting:ColumnDataPoint">
            <Setter Property="Background" Value="DarkGray"/>
            <Setter Property="Template">
                <Setter.Value>
                    <ControlTemplate TargetType="charting:ColumnDataPoint">
                        <Border BorderBrush="{TemplateBinding BorderBrush}" BorderThickness="{TemplateBinding BorderThickness}">
                            <Grid Background="{Binding FavoriteColor}">
                                <Rectangle>
                                    <Rectangle.Fill>
                                        <LinearGradientBrush>
                                            <GradientStop Color="#88ffffff" Offset="0"/>
                                            <GradientStop Color="#00ffffff" Offset="0.9"/>
                                        </LinearGradientBrush>
                                    </Rectangle.Fill>
                                </Rectangle>
                                <Border BorderBrush="#ccffffff" BorderThickness="1">
                                    <Border BorderBrush="#00ffffff" BorderThickness="1"/>
                                </Border>
                            </Grid>
                        </Border>
                    </ControlTemplate>
                </Setter.Value>
            </Setter>
        </Style>
    </Application.Resources>
</Application>
第二步:修改MainPage.xaml的清单代码如下
<UserControl x:Class="testChart3.MainPage"
    xmlns="http://schemas.microsoft.com/winfx/2006/xaml/presentation"
    xmlns:x="http://schemas.microsoft.com/winfx/2006/xaml"
    xmlns:d="http://schemas.microsoft.com/expression/blend/2008"
    xmlns:mc="http://schemas.openxmlformats.org/markup-compatibility/2006"
    xmlns:charting="clr-namespace:System.Windows.Controls.DataVisualization.Charting;assembly=System.Windows.Controls.DataVisualization.Toolkit"
    mc:Ignorable="d"
    d:DesignHeight="300" d:DesignWidth="400">

    <Grid x:Name="LayoutRoot" Background="White">
        <charting:Chart x:Name="FavoriteColorColumnChart" Title="Grades - By Favorite Color" Grid.Column="0">
        </charting:Chart>
    </Grid>
</UserControl>
第三步:MainPage.xaml.cs的代码清单如下
using System;
using System.Collections.Generic;
using System.Linq;
using System.Net;
using System.Windows;
using System.Windows.Controls;
using System.Windows.Documents;
using System.Windows.Input;
using System.Windows.Media;
using System.Windows.Media.Animation;
using System.Windows.Shapes;

using System.Windows.Controls.DataVisualization.Charting;

namespace testChart3
{
    public partial class MainPage : UserControl
    {
        public MainPage()
        {
            InitializeComponent();

            //准备数据
            List<Student> dynamicData = new List<Student>();
            dynamicData.Add(new Student("inuyasha"  , new SolidColorBrush(Color.FromArgb(255, 200, 255, 255))) { Grade = 55.0 });
            dynamicData.Add(new Student("kagula"    , new SolidColorBrush(Color.FromArgb(255, 255, 200, 255))) { Grade = 79.0 });
            dynamicData.Add(new Student("kikoyo"    , new SolidColorBrush(Color.FromArgb(255, 255, 255, 200))) { Grade = 99.5 });
            dynamicData.Add(new Student("sagurajian", new SolidColorBrush(Color.FromArgb(255, 255, 200, 200))) { Grade = 27.5 });


            ColumnSeries cs = new ColumnSeries();
            cs.IndependentValueBinding = new System.Windows.Data.Binding("Name");//X轴变量名
            cs.DependentValueBinding = new System.Windows.Data.Binding("Grade");//Y轴变量名
            //如何变量名没有找到,绑定数据源后导致Chart控件显示空白。

            /*  ColorByPreferenceColumn网络在App.xaml里也可以这样定义
             *  <style x:Key="ColorByPreferenceColumn" TargetType="charting:columnDataPoint">
             *    <Setter Property="Background" Value="{Binding FavoriteColor}"/>
             *  </style>
             */
            cs.DataPointStyle = Application.Current.Resources["ColorByPreferenceColumn"] as Style;//使用在XAML中定义的"ColorByPreferenceColumn"风格
            //如何风格没有找到,绑定数据源后导致Chart控件显示空白。

            cs.ItemsSource = dynamicData;//数据绑定


            FavoriteColorColumnChart.Series.Add(cs); //Series控件放入Chart控件中
        }
    }
}
其它代码:Student的定义
 public class Student : INotifyPropertyChanged
    {
        // Student's name
        public string Name { get; private set; }

        // Student's favorite color
        public Brush FavoriteColor { get; private set; }

        // Student's grade
        public double Grade
        {
            get { return _grade; }
            set
            {
                _grade = value;
                if(PropertyChanged!=null)
                    PropertyChanged(this, new PropertyChangedEventArgs("Grade"));
            }
        }
        private double _grade;

        // Student constructor
        public Student(string name, Brush favoriteColor)
        {
            Name = name;
            FavoriteColor = favoriteColor;
        }

        // INotifyPropertyChanged event
        public event PropertyChangedEventHandler PropertyChanged;
    }
运行效果图
例二:testChart4项目:根据学生成绩的好坏矩形的颜色分别为绿色、黄色、红色。
第一步:新建Silverlight4 应用项目,修改App.xaml的代码如下
<Application xmlns="http://schemas.microsoft.com/winfx/2006/xaml/presentation"
             xmlns:x="http://schemas.microsoft.com/winfx/2006/xaml"
             xmlns:charting="clr-namespace:System.Windows.Controls.DataVisualization.Charting;assembly=System.Windows.Controls.DataVisualization.Toolkit"
             x:Class="testChart4.App"
             >
    <Application.Resources>
        <Style x:Key="ColorByGradeColumn" TargetType="charting:ColumnDataPoint">
            <Setter Property="Background" Value="DarkGray"/>
            <Setter Property="Template">
                <Setter.Value>
                    <ControlTemplate
                            TargetType="charting:ColumnDataPoint">
                        <Border
                                BorderBrush="{TemplateBinding BorderBrush}"
                                BorderThickness="{TemplateBinding BorderThickness}">
                            <Grid Background="{Binding GradeColor}">
                                <Rectangle>
                                    <Rectangle.Fill>
                                        <LinearGradientBrush>
                                            <GradientStop Color="#77ffffff" Offset="0"/>
                                            <GradientStop Color="#00ffffff" Offset="1"/>
                                        </LinearGradientBrush>
                                    </Rectangle.Fill>
                                </Rectangle>
                                <Border BorderBrush="#ccffffff" BorderThickness="1">
                                    <Border BorderBrush="#77ffffff" BorderThickness="1"/>
                                </Border>
                            </Grid>
                        </Border>
                    </ControlTemplate>
                </Setter.Value>
            </Setter>
        </Style>
    </Application.Resources>
</Application>
第二步:修改MainPage.xaml的清单代码如下
<UserControl x:Class="testChart4.MainPage"
    xmlns="http://schemas.microsoft.com/winfx/2006/xaml/presentation"
    xmlns:x="http://schemas.microsoft.com/winfx/2006/xaml"
    xmlns:d="http://schemas.microsoft.com/expression/blend/2008"
    xmlns:mc="http://schemas.openxmlformats.org/markup-compatibility/2006"
    xmlns:datavis="clr-namespace:System.Windows.Controls.DataVisualization;assembly=System.Windows.Controls.DataVisualization.Toolkit"
    xmlns:charting="clr-namespace:System.Windows.Controls.DataVisualization.Charting;assembly=System.Windows.Controls.DataVisualization.Toolkit"
    mc:Ignorable="d"
    d:DesignHeight="300" d:DesignWidth="400">

    <Grid x:Name="LayoutRoot" Background="White">
        <Grid.RowDefinitions>
            <RowDefinition/>
            <RowDefinition Height="Auto"/>
        </Grid.RowDefinitions>
        <Grid.ColumnDefinitions>
            <ColumnDefinition/>
        </Grid.ColumnDefinitions>
        <charting:Chart Name="chart" Title="我的图表">
        </charting:Chart>
        <Button
            Content="Randomize Grades"
            Click="RandomizeGradesClick"
            Grid.ColumnSpan="3"
            Grid.Row="1"/>
    </Grid>
</UserControl>
第三步:MainPage.xaml.cs的代码清单如下
using System;
using System.Collections.Generic;
using System.Linq;
using System.Net;
using System.Windows;
using System.Windows.Controls;
using System.Windows.Documents;
using System.Windows.Input;
using System.Windows.Media;
using System.Windows.Media.Animation;
using System.Windows.Shapes;
using System.Windows.Controls.DataVisualization.Charting;
using System.Collections.ObjectModel;

namespace testChart4
{
    public partial class MainPage : UserControl
    {
        // Collection of Student data objects
        private ObservableCollection<Student> _students = new ObservableCollection<Student>();

        // Collection of StudentViewModel view model objects
        private ObservableCollection<StudentViewModel> _studentViewModels = new ObservableCollection<StudentViewModel>();

        // Random number generator
        private Random _random = new Random();

        public MainPage()
        {
            InitializeComponent();

            //准备数据
            _students.Add(new Student("inuyasha",   new SolidColorBrush { Color = Colors.Blue }));
            _students.Add(new Student("kagula",     new SolidColorBrush { Color = Colors.Blue }));
            _students.Add(new Student("kikyoyo",    new SolidColorBrush { Color = Colors.Blue }));
            _students.Add(new Student("sagulajian", new SolidColorBrush { Color = Colors.Blue }));

            foreach (Student _student in _students)
            {
                _studentViewModels.Add(new StudentViewModel(_student));
            }

            // Assign random grades
            AssignRandomGrades();

            ColumnSeries cs = new ColumnSeries();
            cs.IndependentValueBinding = new System.Windows.Data.Binding("Student.Name");//X轴变量名
            cs.DependentValueBinding = new System.Windows.Data.Binding("Student.Grade");//Y轴变量名
            cs.DataPointStyle = Application.Current.Resources["ColorByGradeColumn"] as Style;//使用在XAML中定义的"ColorByPreferenceColumn"风格
            cs.ItemsSource = _studentViewModels;//数据绑定
            IAxis valueAxis = new LinearAxis
            {
                Orientation = AxisOrientation.Y,
                ShowGridLines = true,
                Minimum = 0,
                Maximum = 100,
                Title = "考试成绩"
            };
            chart.Axes.Add(valueAxis);
            chart.Series.Add(cs); //Series控件放入Chart控件中
        }

        // Assign random grades to each Student object
        private void AssignRandomGrades()
        {
            foreach (var student in _students)
            {
                student.Grade = Math.Round((_random.NextDouble() * 70) + 30, 1);
            }
        }

        // Handle clicks on the "Randomize Grades" button
        private void RandomizeGradesClick(object sender, RoutedEventArgs e)
        {
            AssignRandomGrades();
        }
    }
}
其它代码:StudentViewModel的定义
 public class StudentViewModel : INotifyPropertyChanged
    {
        // Student object
        public Student Student { get; private set; }

        // Color representing Student's Grade
        public Brush GradeColor { get; private set; }

        // StudentViewModel constructor
        public StudentViewModel(Student student)
        {
            Student = student;
            student.PropertyChanged += new PropertyChangedEventHandler(HandleStudentPropertyChanged);
        }

        // Detect changes to the Student's grade and update GradeColor
        void HandleStudentPropertyChanged(object sender, PropertyChangedEventArgs e)
        {
            if ("Grade" == e.PropertyName)
            {
                if (Student.Grade < 50)
                {
                    GradeColor = new SolidColorBrush { Color = Colors.Red };
                }
                else if (Student.Grade < 80)
                {
                    GradeColor = new SolidColorBrush { Color = Colors.Yellow };
                }
                else
                {
                    GradeColor = new SolidColorBrush { Color = Colors.Green };
                }
                if(PropertyChanged!=null)
                    PropertyChanged(this, new PropertyChangedEventArgs("GradeColor"));
            }
        }

        // INotifyPropertyChanged event
        public event PropertyChangedEventHandler PropertyChanged;
    }
运行效果图
点击“Randomize Grades”按钮后,会重新生成图表。
建议你完成本文后再参考资料[1]以不同的代码风格再实现一遍。
参考资料
[1]《Columns of a different color [Customizing the appearance of Silverlight charts with re-templating and MVVM]》
http://blogs.msdn.com/b/delay/archive/2009/02/04/columns-of-a-different-color-customizing-the-appearance-of-silverlight-charts-with-re-templating-and-mvvm.aspx
