C#GDI绘图
GDI+ 是 Windows XP 操作系统中提供二维矢量图形、图像处理和版式的部分。GraphicsDevice Interface Plus也就是图形设备接口,提供了各种丰富的图形图像处理功能;在C#.NET中,使用GDI+处理二维(2D)的图形和图像,使用DirectX处理三维(3D)的图形图像,图形图像处理用到的主要命名空间是System . Drawing:提供了对GDI+基本图形功能的访问,主要有Graphics类、Bitmap类、从Brush类继承的类、Font类、Icon类、Image类、Pen类、Color类等。
转载csdn专家博客:http://blog.csdn.net/byxdaz/article/details/6747058#
一、GDI+相关命名空间、类、结构
1、主要有由以下几个命名空间组成
System.Drawing; 核心的命名空间,定义了基本的绘制类型如:(字体、钢笔、画笔、Graphics)
System.Drawing.Drawing2D; 提供了一组操作二维矢量图和几何图形的类型
System.Drawing.Printing; 打印相关类型
System.Drawing.Imaging; 操作图像的一组类型
System.Drawing.Text; 操作字体的一组类型
System.Drawing.Graphics :封装一个 GDI+ 绘图图面,Graphics 类提供将对象绘制到显示设备的方法.
System.Drawing.Image : 为源自bitmap 和 metafile 的类提供功能的抽象基类
System.Drawing.Bitmap :封装 GDI+ 位图,此位图由图形图像及其属性的像素数据组成。
Bitmap 是用于处理由像素数据定义的图像的对象
System.Drawing.Imaging.Metafile :定义图形图元文件。图元文件包含描述一系列图形操作的记录, 这些操作可以被记录(构造)和被回放(显示)。此类不能继承
System.Drawing.Font :定义特定的文本格式,包括字体、字号和字形属性。无法继承此类。
System.Drawing.Brush :定义用于填充图形形状(如矩形、椭圆、饼形、多边形和封闭路径)的内部的对象
System.Drawing.Color :表示 ARGB(一种色彩空间,也就是RGB色彩空间附加上Alpha(透明度)通道,常见于32位位图的存储结构) 颜色
System.Drawing.Drawing2D.Matrix :封装表示几何变换的 3 x 3 仿射矩阵。无法继承此类。
System.Windows.Forms.TextRenderer :提供用于测量和呈现文本的方法。无法继承此类。
双缓冲:为了避免闪屏,先把要显示的图象在内存实现,然后把实现后的图象一起传到要显示的区域。
2、常用类型
主要类型
Graphics、Pen、Brush、Color、Font、Region、StringFormat、Point、Rectangle、Size等。
Graphics对象
(1)利用窗体或控件的Paint事件的参数PaintEventArgs创建Graphics对象。
(2)使用窗体或控件的CreateGraphics方法
Graphics g=this.CreateGraphics();
(3)使用Image的派生类创建Graphics对象。使用Image的任何派生类均可以生成相应的Graphics对象,这种方法一般适用于在C#中对图像进行处理的场合。
Bitmap b=new Bitmap("Mybmp.bmp");
Graphics g=Graphics.FromImage(b);
Pen对象
Pen类的构造函数有四种,使用方法如下。
(1)创建某一颜色的Pen对象:public Pen(Color)
(2)创建某一刷子样式的Pen对象:public Pen(Brush)
(3)创建某—刷子样式并具有相应宽度的Pen对象:publicPen(Brush,float)
(4)创建某一颜色和相应宽度的Pen对象:public Pen(Color,float)
Pen对象的常用属性
(1)Alignment属性:用来获取或设置此Pen对象的对齐方式。
(2)Color属性:用来获取或设置此Pen对象的颜色。
(3)Width属性:用来获取或设置此Pen对象的宽度。
(4)DashStyle属性:用来获取或设置通过此Pen对象绘制的虚线的样式。
(5)DashCap属性:用来指定虚线两端风格,是一个DashCap枚举型的值。
(6)StartCap属性:用来获取或设置通过此Pen对象绘制的直线起点的帽样式。
(7)EndCap属性:用来获取或设置通过此Pen对象绘制的直线终点的帽样式。
(8)PenType属性:用来获取用此Pen对象绘制的直线的样式。
Font对象
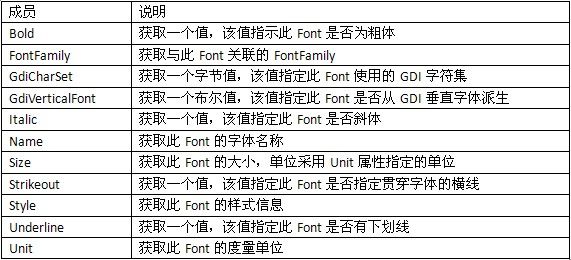
Font用于定义特定的文本格式,包括字体、字号和字形属性。
下表列举了常用方法和属性。
下面这行代码将构建一个10磅大小的宋体字体。
System.Drawing.Font f1 = newSystem.Drawing.Font("宋体",10);
Image对象
Image是为源自Bitmap和Metafile的类提供功能的抽象基类。下表列举了常用的方法和属性。
Image不可以实例化,但可以通过方法来构造:
System.Drawing.Image img1 =System.Drawing.Image.FromFile(Server.MapPath("~/logo.gif"));
Image是基类,封装了很多有用的属性和方法,而实际运用时,尤其在生成或者修改图像的时候,一般用其派生类Bitmap表示内存中的图形。Bitmap是用于处理由像素数据定义的图像的对象,是图像处理开发中最常用的对象。用户可以通过多种途径构造Bitmap对象。
System.Drawing.Bitmap bmp1 = newSystem.Drawing.Bitmap(Server.MapPath("~/logo.gif")); // 通过文件构造
System.Drawing.Bitmap bmp2 = newSystem.Drawing.Bitmap(300,200); // 构造一个宽300,高200的对象
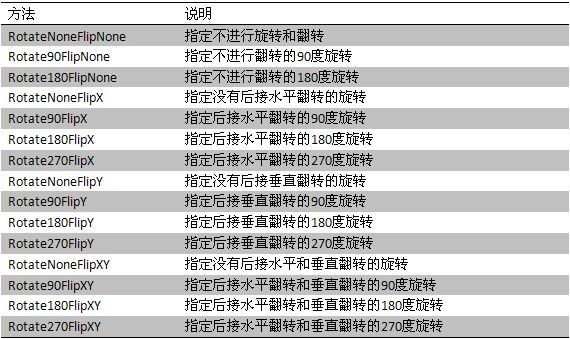
构造完对象后,可以调用其方法进行操作,比如RotateFlip方法可以实现图像反转,该方法接收RotateFlipType类型的参数,可以的值如下表。
比如:
System.Drawing.Bitmap bmp1 = newSystem.Drawing.Bitmap(Server.MapPath("~/logo.gif")); // 通过文件构造
bmp1.RotateFlip(System.Drawing.RotateFlipType.Rotate90FlipX);// 水平翻转90度旋转
// 原书中没有这句,这里要加上这句,如果不加这句则在非IE浏览器显示不出
Response.ContentType = "image/JPEG";
bmp1.Save(Response.OutputStream,System.Drawing.Imaging.ImageFormat.Jpeg);
Brush对象
1.SolidBrush画刷
SolidBrush类用来定义单一颜色的Brush,其构造函数如下。
public SolidBrush(Color.Color)
2.HatchBrush画刷
HatchBrush类的构造函数有两种,分别如下:
[格式1]:publicHatchBrush(HatchStyle, Color);
[格式2]:publicHatchBrush(HatchStyle, Color, Color); HatchBrush画刷具有三个属性,分别如下:
(1)BackgroundColor属性:获取此HatchBrush 对象的背景色。
(2)ForegroundColor属性:获取此HatchBrush 对象的前景色。
(3)HatchStyle属性:获取此HatchBrush 对象的阴影样式。
3.LinearGradientBrush画刷
LinearGradientBrush类的构造函数有多种格式,最常用的格式如下。
public LinearGradientBrush(Point1, Point2,Color1, Color2);
常用图形的绘制方法
1.画直线
[格式1]:public voidDrawLine(Pen pen,int x1,int y1,int x2,int y2);
[格式2]:public voidDrawLine(Pen pen,Point pt1,Point pt2);
2.画椭圆
[格式1]:public voidDrawEllipse( Pen pen, Rectangle rect);
[格式2]:public voidDrawEllipse(Pen pen,int x,int y,int width, int height);
3.绘制圆弧
[格式1]:public void DrawArc(Pen pen,Rectangle rect,float startAngle,floatsweepAngle);
[格式2]:public voidDrawArc(Pen pen,int x,int y,int width,int height,int startAngle,intsweepAngle);
4.画扇形图
使用Graphics对象的DrawPie方法可以绘制扇形图,所谓扇形图其实就是把一段圆弧的两个端点与圆心相连。DrawPie方法的格式与DrawArc方法基本一致。
5.画矩形
[格式1]: public void DrawRectangle( Pen pen, Rectangle rect);
[格式2]:public voidDrawRectangle(Pen pen,int x,int y,int width,int height);
6.画Bezier曲线
[格式1]:public voidDrawBezier(Pen pen,Point pt1,Point pt2,Point pt3,Point pt4);
[格式2]:public voidDrawBezier(Pen pen,float x1,float y1,float x2,float y2,float x3,float y3,floatx4,float y4);
7.画多边形
[格式1]:public voidDrawPolygon(Pen pen, Point[] points);
[格式2]:public voidDrawPolygon(Pen pen, PointF[] points);
8.绘制闭合曲线
[格式1]:public voidDrawClosedCurve(Pen pen,Point[] points);
[格式2]:public voidDrawClosedCurve(Pen pen,Point[] points,float tension,FillMode fillmode);
9.绘制非闭合曲线
[格式]:public voidDrawCurve( Pen pen,Point[] points);
10.绘制路径
[格式]:public voidDrawPath(Pen pen,GraphicsPathpath);
11.填充椭圆
[格式1]:public voidFillEllipse(Brush brush, Rectangle rect);
[格式2]:public voidDrawEllipse(Brush brush,int x,int y,int width, int height);
12.填充矩形
[格式1]: public void FillRectangle( Brush brush, Rectangle rect);
[格式2]:public voidFillRectangle(Brush brush,int x,int y,int width,int height);
13.填充饼图
[格式1]:public voidFillPie(Brush brush,Rectangle rect,float startAngle,float sweepAngle)
[格式2]:public voidFillPie(Brush brush,int x,int y,int width,int height,int startAngle,intsweepAngle);
3、专业术语
世界坐标系、页面坐标系、设备坐标系
二、双缓冲技术
c#如何实现防窗体闪烁的功能。大家都会想到运用双缓冲技术,那么在c#中是如何做的?
1、 利用默认双缓冲
(1)在应用程序中使用双缓冲的最简便的方法是使用 .NETFramework 为窗体和控件提供的默认双缓冲。通过将 DoubleBuffered 属性设置为 true。
this.DoubleBuffered=true;
(2)使用 SetStyle 方法可以为 Windows 窗体和所创作的 Windows 控件启用默认双缓冲。
SetStyle(ControlStyles.OptimizedDoubleBuffer, true);
2、 手工设置双缓冲
.netframework提供了一个类BufferedGraphicsContext负责单独分配和管理图形缓冲区。每个应用程序域都有自己的默认BufferedGraphicsContext 实例来管理此应用程序的所有默认双缓冲。大多数情况下,每个应用程序只有一个应用程序域,所以每个应用程序通常只有一个默认 BufferedGraphicsContext。默认 BufferedGraphicsContext 实例由 BufferedGraphicsManager 类管理。通过管理BufferedGraphicsContext实现双缓冲的步骤如下:
(1)获得对 BufferedGraphicsContext 类的实例的引用。
(2)通过调用 BufferedGraphicsContext.Allocate方法创建BufferedGraphics 类的实例。
(3)通过设置 BufferedGraphics.Graphics 属性将图形绘制到图形缓冲区。
(4)当完成所有图形缓冲区中的绘制操作时,可调用BufferedGraphics.Render 方法将缓冲区的内容呈现到与该缓冲区关联的绘图图面或者指定的绘图图面。
(5)完成呈现图形之后,对 BufferedGraphics 实例调用释放系统资源的 Dispose 方法。
完整的例子,在一个400*400的矩形框内绘制10000个随机生成的小圆。
view plaincopy to clipboardprint?
BufferedGraphicsContext current = BufferedGraphicsManager.Current; //(1)
BufferedGraphics bg;
bg = current.Allocate(this.CreateGraphics(),this.DisplayRectangle); //(2)
Graphics g = bg.Graphics;//(3)
//随机 宽400 高400
System.Random rnd = new Random();
int x,y,w,h,r,i;
for (i = 0; i < 10000; i++)
{
x = rnd.Next(400);
y = rnd.Next(400);
r = rnd.Next(20);
w = rnd.Next(10);
h = rnd.Next(10);
g.DrawEllipse(Pens.Blue, x, y, w, h);
}
bg.Render();//(4)
//bg.Render(this.CreateGraphics());
bg.Dispose();//(5)
3、 自己开辟一个缓冲区(如一个不显示的Bitmap对象),在其中绘制完成后,再一次性显示。
完整代码如下:
view plaincopy to clipboardprint?
Bitmap bt = new Bitmap(400, 400);
Graphics bg = Graphics.FromImage(bt);
System.Random rnd = new Random();
int x, y, w, h, r, i;
for (i = 0; i < 10000; i++)
{
x = rnd.Next(400);
y = rnd.Next(400);
r = rnd.Next(20);
w = rnd.Next(10);
h = rnd.Next(10);
bg.DrawEllipse(Pens.Blue, x, y, w, h);
}
this.CreateGraphics().DrawImage(bt, new Point(0, 0));
三、绘图实例
当我们的软件需要各种饼状图和柱状图来表示数据时,我们或许会想到用Offices中的图形控件或是第三方控件,但现在的第三方控件大都需要注册,有些免费的控件会有开发商的标记等。而对于使用Offices的图形控件来说,并不能在程序中得于很好控制,其使用的简易程度也较低,所以在这我给出在C#使用GDI+实现饼状图和柱状图跟数据库联接显示数据的方法。
using System;
using System.IO;//用于文件存取
using System.Data;//用于数据访问
using System.Drawing;//提供画GDI+图形的基本功能
using System.Drawing.Text;//提供画GDI+图形的高级功能
using System.Drawing.Drawing2D;//提供画高级二维,矢量图形功能
using System.Drawing.Imaging;//提供画GDI+图形的高级功能
namespace BaseLayer
{
public class PieChart
{
public PieChart()
{
}
//Render是图形大标题,图开小标题,图形宽度,图形长度,
饼图的数据集和饼图的数据集要表示出来的数据
public Image Render(string title, stringsubTitle, int width,
int height, DataSet chartData,int DataLine)
{
const int SIDE_LENGTH = 400;
const int PIE_DIAMETER = 200;
DataTable dt = chartData.Tables[0];
//通过输入参数,取得饼图中的总基数
float sumData = 0;
foreach(DataRow dr in dt.Rows)
{
sumData +=Convert.ToSingle(dr[DataLine]);
}
//产生一个image对象,并由此产生一个Graphics对象
Bitmap bm = new Bitmap(width,height);
Graphics g = Graphics.FromImage(bm);
//设置对象g的属性
g.ScaleTransform((Convert.ToSingle(width))/SIDE_LENGTH,
(Convert.ToSingle(height))/SIDE_LENGTH);
g.SmoothingMode =SmoothingMode.Default;
g.TextRenderingHint =TextRenderingHint.AntiAlias;
//画布和边的设定
g.Clear(Color.White);
g.DrawRectangle(Pens.Black,0,0,SIDE_LENGTH-1,SIDE_LENGTH-1);
//画饼图标题
g.DrawString(title,newFont("Tahoma",14),Brushes.Black,new PointF(5,5));
//画饼图的图例
g.DrawString(subTitle,newFont("Tahoma",12),Brushes.Black,new PointF(7,35));
//画饼图
float curAngle = 0;
float totalAngle = 0;
for(int i=0;i<dt.Rows.Count;i++)
{
curAngle =Convert.ToSingle(dt.Rows[i][DataLine]) / sumData * 360;
g.FillPie(newSolidBrush(ChartUtil.GetChartItemColor(i)),
100,65,PIE_DIAMETER,PIE_DIAMETER,totalAngle,curAngle);
g.DrawPie(Pens.Black,100,65,PIE_DIAMETER,PIE_DIAMETER,totalAngle,curAngle);
totalAngle += curAngle;
}
//画图例框及其文字
g.DrawRectangle(Pens.Black,200,300,199,99);
g.DrawString("图表说明",newFont("Tahoma",12,FontStyle.Bold),
Brushes.Black,new PointF(200,300));
//画图例各项
PointF boxOrigin = newPointF(210,330);
PointF textOrigin = newPointF(235,326);
float percent = 0;
for(int i=0;i<dt.Rows.Count;i++)
{
g.FillRectangle(newSolidBrush(ChartUtil.GetChartItemColor(i)),
boxOrigin.X,boxOrigin.Y,20,10);
g.DrawRectangle(Pens.Black,boxOrigin.X,boxOrigin.Y,20,10);
percent = Convert.ToSingle(dt.Rows[i][DataLine])/ sumData * 100;
g.DrawString(dt.Rows[i][1].ToString() +" - " + dt.Rows[i][0].ToString() +
" (" + percent.ToString("0") + "%)",newFont("Tahoma",10),Brushes.Black,textOrigin);
boxOrigin.Y += 15;
textOrigin.Y += 15;
}
//回收资源
g.Dispose();
return (Image) bm;
}
}
//画条形图
public class BarChart
{
public BarChart()
{
}
//Render是图形大标题,图开小标题,图形宽度,图形长度,饼图的数据集和饼图的数据集
public Image Render
(string title, string subTitle, int width, int height, DataSet chartData)
{
const int SIDE_LENGTH = 400;
const int CHART_TOP = 75;
const int CHART_HEIGHT = 200;
const int CHART_LEFT = 50;
const int CHART_WIDTH = 300;
DataTable dt = chartData.Tables[0];
//计算最高的点
float highPoint = 0;
foreach(DataRow dr in dt.Rows)
{
if(highPoint<Convert.ToSingle(dr[0]))
{
highPoint = Convert.ToSingle(dr[0]);
}
}
//建立一个Graphics对象实例
Bitmap bm = new Bitmap(width,height);
try
{
Graphics g = Graphics.FromImage(bm);
//设置条图图形和文字属性
g.ScaleTransform((Convert.ToSingle(width))/SIDE_LENGTH,
(Convert.ToSingle(height))/SIDE_LENGTH);
g.SmoothingMode =SmoothingMode.Default;
g.TextRenderingHint =TextRenderingHint.AntiAlias;
//设定画布和边
g.Clear(Color.White);
g.DrawRectangle(Pens.Black,0,0,SIDE_LENGTH-1,SIDE_LENGTH-1);
//画大标题
g.DrawString(title,newFont("Tahoma",14),Brushes.Black,new PointF(5,5));
//画小标题
g.DrawString(subTitle,newFont("Tahoma",12),Brushes.Black,new PointF(7,35));
//画条形图
float barWidth = CHART_WIDTH /(dt.Rows.Count * 2);
PointF barOrigin = new PointF(CHART_LEFT +(barWidth / 2),0);
float barHeight = dt.Rows.Count;
for(int i=0;i<dt.Rows.Count;i++)
{
barHeight = Convert.ToSingle(dt.Rows[i][0])* 200 / highPoint * 1;
barOrigin.Y = CHART_TOP + CHART_HEIGHT -barHeight;
g.FillRectangle(newSolidBrush(ChartUtil.GetChartItemColor(i)),
barOrigin.X,barOrigin.Y,barWidth,barHeight);
barOriginbarOrigin.X = barOrigin.X +(barWidth * 2);
}
//设置边
g.DrawLine(new Pen(Color.Black,2),newPoint(CHART_LEFT,CHART_TOP),
new Point(CHART_LEFT,CHART_TOP + CHART_HEIGHT));
g.DrawLine(new Pen(Color.Black,2),newPoint(CHART_LEFT,CHART_TOP +
CHART_HEIGHT),new Point(CHART_LEFT + CHART_WIDTH,CHART_TOP + CHART_HEIGHT));
//画图例框和文字
g.DrawRectangle(newPen(Color.Black,1),200,300,199,99);
g.DrawString("图表说明",newFont("Tahoma",12,FontStyle.Bold),
Brushes.Black,new PointF(200,300));
//画图例
PointF boxOrigin = newPointF(210,330);
PointF textOrigin = newPointF(235,326);
for(int i=0;i<dt.Rows.Count;i++)
{
g.FillRectangle(newSolidBrush(ChartUtil.GetChartItemColor(i)),
boxOrigin.X,boxOrigin.Y,20,10);
g.DrawRectangle(Pens.Black,boxOrigin.X,boxOrigin.Y,20,10);
g.DrawString(dt.Rows[i][1].ToString() +" - " + dt.Rows[i][0].
ToString(),new Font("Tahoma",10),Brushes.Black,textOrigin);
boxOrigin.Y += 15;
textOrigin.Y += 15;
}
//输出图形
g.Dispose();
return bm;
}
catch
{
return bm;
}
}
}
public class ChartUtil
{
public ChartUtil()
{
}
public static Color GetChartItemColor(intitemIndex)
{
Color selectedColor;
switch(itemIndex)
{
case 0:
selectedColor = Color.Blue;
break;
case 1:
selectedColor = Color.Red;
break;
case 2:
selectedColor = Color.Yellow;
break;
case 3:
selectedColor = Color.Purple;
break;
default:
selectedColor = Color.Green;
break;
}
return selectedColor;
}
}
}
以上是一个完整的WinForm中制作饼状图和柱状图源程序,大家可以通过以上程序的更改,做出能满足自己程序的需要。C#使用GDI+实现饼状图和柱状图跟数据库联接显示数据的方法。
四、GDI+中常见的几个问题
GDI+中常见的几个问题(1)
GDI+中常见的几个问题(2)
GDI+中常见的几个问题(3)
GDI+中常见的几个问题(4)
GDI+中常见的几个问题(5)
GDI+中常见的几个问题(6)
GDI+中常见的几个问题(7)
GDI+中常见的几个问题(8)
GDI+中常见的几个问题(9)
GDI+中常见的几个问题(10)
GDI+中常见的几个问题(11)
参考资料:
c# GDI+简单绘图:http://www.cnblogs.com/stg609/archive/2008/03/16/1108333.html
NET3.5GDI+ 图形操作:
http://cfg1014.blog.163.com/blog/static/66343992009824102219103/

