Cloud Design Pattern - Health Endpoint Monitoring(健康端点监测)
1.前言
上一篇我们讨论了云计算设计模式之守门人模式,介绍了通过在服务与客户端之间通过代理来实现请求的过滤的方式来提升系统安全性.这一篇我们讨论下服务的监测的问题.对于任何一个服务来说,监测都是必要的,不仅仅是在服务出问题的时候,我们需要根据监测信息及时追踪问题根源,而且需要跟踪监测信息评估系统性能,做更多的优化工作.
2.概念
无论是我们自己开发的服务,还是依赖的第三方服务,我们都需要一种监测机制来实时监测服务的健康状况.尤其是针对第三方服务的监测,能够在很多时候,及时发现问题并采取措施进行干预.一个服务应该能够相应关于服务健康状态监测的请求.
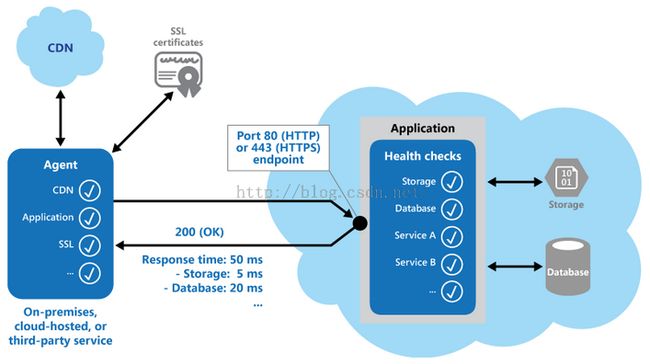
上图中所展示的监测包括存储(非数据库)的可用性,数据库的可用性及各个所依赖的服务的可用性的监测.可监测的项应该包括但不限于:
1) Http Response 状态码.通常我们认为200是正常状态,而500是非正常状态.
2) 在返回的状态码为200时,检查返回的内容.比如返回的Tilte是否是我们期望的,而不仅仅是检查状态码是200.
3) 记录服务响应事件,评估网络延迟是否影响整体性能.
4) 评估第三方服务的性能.
5) 检查SSL证书是否已过期.
6) 检查URL的DNS路由解析延迟时间或者能否成功解析.
7) 检查DNS解析服务器返回的URL,这样做能避免通过攻击DNS服务器后恶意的URL重定向.
这些检查项都是云计算中推荐的检查项,那该如何去检查呢?
1) 如何检查Http请求返回的状态码.仅仅检查返回的是否是200是不够的,因为某些服务需要在很短的响应时间内响应请求.
2) 服务暴露服务端点的个数.通常的做法是主服务暴露一个端点,其他的服务根据安全要求的不同,分别暴露服务端点.
3) 设计状态检查需要包含的信息类型,数据项及如何返回这些信息.
4) 确保状态检查服务的安全.
5) 确保Agent正常运行.
何时该使用这种模式:
1)Monitoring websites and web applications to verify availability.
2)Monitoring websites and web applications to check for correct operation.
3)Monitoring middle-tier or shared services to detect and isolate a failure that could disrupt other applications.
4)To complement existing instrumentation within the application, such as performance counters and error handlers. Health verification checking does not replace the requirement for logging and auditing in the application. Instrumentation can provide valuable information for an existing framework that monitors counters and error logs to detect failures or other issues. However, it cannot provide information if the application is unavailable.
4.Example
下面的例子是官网中推荐的做法,示例代码啊如下:
public ActionResult CoreServices()
{
  try
  {
    // Run a simple check to ensure the database is available.
    DataStore.Instance.CoreHealthCheck();

    // Run a simple check on our external service.
    MyExternalService.Instance.CoreHealthCheck();
  }
  catch (Exception ex)
  {
    Trace.TraceError("Exception in basic health check: {0}", ex.Message);

    // This can optionally return different status codes based on the exception.
    // Optionally it could return more details about the exception.
    // The additional information could be used by administrators who access the
    // endpoint with a browser, or using a ping utility that can display the
    // additional information.
    return new HttpStatusCodeResult((int)HttpStatusCode.InternalServerError);
  }
  return new HttpStatusCodeResult((int)HttpStatusCode.OK);
}
这样的情形下,我们无法通过参数来校验并决定何时该处理监测的请求,那么下面的做法给出了一个范例.
public ActionResult ObscurePath(string id)
{
  // The id could be used as a simple way to obscure or hide the endpoint.
  // The id to match could be retrieved from configuration and, if matched,
  // perform a specific set of tests and return the result. It not matched it
  // could return a 404 Not Found status.

  // The obscure path can be set through configuration in order to hide the endpoint.
  var hiddenPathKey = CloudConfigurationManager.GetSetting("Test.ObscurePath");

  // If the value passed does not match that in configuration, return 403 "Not Found".
  if (!string.Equals(id, hiddenPathKey))
  {
    return new HttpStatusCodeResult((int)HttpStatusCode.NotFound);
  }

  // Else continue and run the tests...
  // Return results from the core services test.
  return this.CoreServices();
}
有时候,为了做一些特殊的检查,需要返回一些特殊的状态码,下面的做法正好实现了这一点.
public ActionResult TestResponseFromConfig()
{
  // Health check that returns a response code set in configuration for testing.
  var returnStatusCodeSetting = CloudConfigurationManager.GetSetting(
                                                          "Test.ReturnStatusCode");

  int returnStatusCode;

  if (!int.TryParse(returnStatusCodeSetting, out returnStatusCode))
  {
    returnStatusCode = (int)HttpStatusCode.OK;
  }

  return new HttpStatusCodeResult(returnStatusCode);
}
最后,在Windows Azure 中,我们可以使用内置的方式了实现对App的监测,当然也可以使用第三方的技术.
1)Use the built-in features of Microsoft Azure, such as the Management Services or Traffic Manager.
2)Use a third party service or a framework such as Microsoft System Center Operations Manager.
3)Create a custom utility or a service that runs on your own or on a hosted server.
下面是Windows Azure Traffic Manager 的官方介绍.
Azure Management Services provides a comprehensive built-in monitoring mechanism built around alert rules. The Alerts section of the Management Services page in the Azure management portal allows you to configure up to ten alert rules per subscription for your services. These rules specify a condition and a threshold value for a service such as CPU load, or the number of requests or errors per second, and the service can automatically send email notifications to addresses you define in each rule.
The conditions you can monitor vary depending on the hosting mechanism you choose for your application (such as Web Sites, Cloud Services, Virtual Machines, or Mobile Services), but all of these include the capability to create an alert rule that uses a web endpoint you specify in the settings for your service. This endpoint should respond in a timely way so that the alert system can detect that the application is operating correctly.
If you host your application in Azure Cloud Services web and worker roles or Virtual Machines, you can take advantage of one of the built-in services in Azure called Traffic Manager. Traffic Manager is a routing and load-balancing service that can distribute requests to specific instances of your Cloud Services hosted application based on a range of rules and settings.
In addition to routing requests, Traffic Manager pings a URL, port, and relative path you specify on a regular basis to determine which instances of the application defined in its rules are active and are responding to requests. If it detects a status code 200 (OK) it marks the application as available, any other status code causes Traffic Manager to mark the application as offline. You can view the status in the Traffic Manager console, and configure the rule to reroute requests to other instances of the application that are responding.
However, keep in mind that Traffic Manager will only wait ten seconds to receive a response from the monitoring URL. Therefore, you should ensure that your health verification code executes within this timescale, allowing for network latency for the round trip from Traffic Manager to your application and back again.
5.相关阅读
The following guidance may also be relevant when implementing this pattern:
Instrumentation and Telemetry Guidance. Checking the health of services and components is typically done by probing, but it is also useful to have the appropriate information in place to monitor application performance and detect events that occur at runtime. This data can be transmitted back to monitoring tools to provide an additional feature for health monitoring. The Instrumentation and Telemetry guidance explores the process of gathering remote diagnostics information that is collected by instrumentation in applications.
Third-party tools Pingdom, Panopta, NewRelic, and Statuscake.
The article Management Services on MSDN.
The article Microsoft Azure Traffic Manager on MSDN.
