使用caffe的python接口实现内部参数可视化
1。这里并不介绍如何训练cnn及caffe配置,主要介绍如何实现cnn内部参数可视化。
#这是我训练时使用的train.prototxt文件,在实现可视化之前首先需要对这个文件进行修改,
#trian.prototxt文件的前2层及尾部需要修改,修改成train_deploy.prototxt文件。
name: "face_train"
layer { name: "face" type: "Data" top: "data" top: "label" data_param { source: "train_lmdb" batch_size: 100 backend:LMDB }
  transform_param { scale: 0.00390625 mirror: true }
  include: { phase: TRAIN }
}
layer { name: "face" type: "Data" top: "data" top: "label" include { phase: TEST }
  transform_param { scale: 0.00390625 }
  data_param { source: "val_lmdb" batch_size: 100 backend: LMDB }
}
layer { name: "conv1" type: "Convolution" bottom: "data" ........... ........... ........... layer { name: "ip1" type: "InnerProduct" bottom: "contact_conv" top: "ip1" param { name: "fc6_w" lr_mult: 1 decay_mult: 1 }
  param { name: "fc6_b" lr_mult: 2 decay_mult: 0 }
  inner_product_param { num_output: 160 weight_filler { type: "gaussian" std: 0.005 }
    bias_filler { type: "constant" value: 0.1 }
}
layer { name: "ip2" type: "InnerProduct" bottom: "ip1" top: "ip2" param { lr_mult: 1 decay_mult: 1 }
  param { lr_mult: 2 decay_mult: 0 }
  inner_product_param { num_output: 200 weight_filler { type: "gaussian" std: 0.01 }
    bias_filler { type: "constant" value: 0 }
  }

}

layer { name: "accuracy" type: "Accuracy" bottom: "ip2" bottom: "label" top: "accuracy" include: { phase: TEST }
}
layer { name: "loss" type: "SoftmaxWithLoss" bottom: "ip2" bottom: "label" top: "loss" }
修改后的train_deploy.prototxt,我这里只需要ip1输出的数据,故删除了ip2及后面所有的层,若需要输出概率,可以先把ip2后的层删除,再添加个softmax层
#train_deploy.prototxt
name: "face_train"
input: "data"
input_dim: 1 #图像个数
input_dim: 3 #通道数
input_dim: 128
input_dim: 128
layer { name: "conv1" type: "Convolution" bottom: "data" ....... ....... ....... layer { name: "ip1" type: "InnerProduct" bottom: "contact_conv" top: "ip1" param { name: "fc6_w" lr_mult: 1 decay_mult: 1 }
  param { name: "fc6_b" lr_mult: 2 decay_mult: 0 }
  inner_product_param { num_output: 160 weight_filler { type: "gaussian" std: 0.005 }
    bias_filler { type: "constant" value: 0.1 }
  }

}- train_deploy文件已创建好,现在是python时间,这里我是在jupyter notebook进行python编程,如果不是在jupyter notebook中运算的话,%matplotlib inline会报错,请先配置好jupyter notebook,这个非常好用
import numpy as np
import matplotlib.pyplot as plt
import os,sys,caffe
%matplotlib inline
caffe_root='/home/chen/Downloads/caffe-master/'
os.chdir(caffe_root)
sys.path.insert(0,caffe_root+'python')

#加载测试图片,并显示
#caffe.io.load_image会把读取的图像转化为float32,并归一化
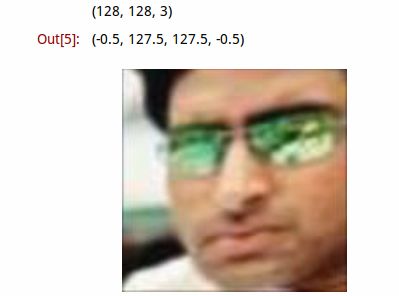
im = caffe.io.load_image('examples/images/image/test_000000-000008.jpg')
print im.shape
plt.imshow(im)
plt.axis('off')
#im的shape是(128,128,3),我们要把它转换成(1,3,128,128)
X=np.empty((1,3,128,128))
X[0,0,:,:]=im[:,:,0]
X[0,1,:,:]=im[:,:,1]
X[0,2,:,:]=im[:,:,2]
caffe.set_mode_gpu()
#加载网络模型和caffemodel
net = caffe.Net(caffe_root + 'examples/images/train2_deploy.prototxt',
caffe_root + 'examples/images/face3_iter_40000.caffemodel',
caffe.TEST)
#将图像数据加载到网络中
net.blobs['data'].data[...] = X
#运行测试模型,并显示各层数据信息
net.forward()
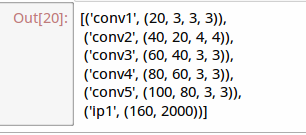
[(k, v.data.shape) for k, v in net.blobs.items()] 上面加载数据到网络时并没有减去均值,因为我这里并没有使用均值。
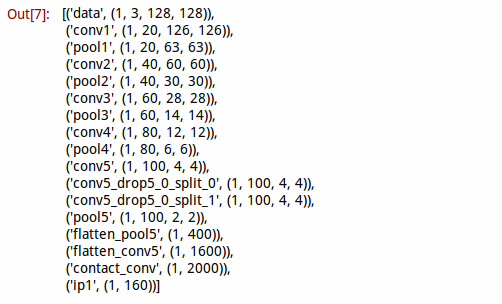
# 编写一个函数,用于显示各层数据
def show_data(Inputdata, padsize=1, padval=0):
    data=Inputdata
    for i in range(data.shape[1]):
        data[0,i] -= data[0,i].min()
        data[0,i]/= data[0,i].max()

    # force the number of filters to be square
    n = int(np.ceil(np.sqrt(data.shape[0])))
    padding = ((0, n ** 2 - data.shape[0]), (0, padsize), (0, padsize)) + ((0, 0),) * (data.ndim - 3)
    data = np.pad(data, padding, mode='constant', constant_values=(padval, padval))

    # tile the filters into an image
    data = data.reshape((n, n) + data.shape[1:]).transpose((0, 2, 1, 3) + tuple(range(4, data.ndim + 1)))
    data = data.reshape((n * data.shape[1], n * data.shape[3]) + data.shape[4:])
    plt.figure()
    plt.imshow(data,cmap='gray')
    plt.axis('off')
plt.rcParams['figure.figsize'] = (8, 8)
plt.rcParams['image.interpolation'] = 'nearest'
plt.rcParams['image.cmap'] = 'gray'
# 编写一个函数,用于显示各层数据
def show_data2(Inputdata, padsize=1, padval=0):
    data=Inputdata
    # force the number of filters to be square
    n = int(np.ceil(np.sqrt(data.shape[0])))
    padding = ((0, n ** 2 - data.shape[0]), (0, padsize), (0, padsize)) + ((0, 0),) * (data.ndim - 3)
    data = np.pad(data, padding, mode='constant', constant_values=(padval, padval))

    # tile the filters into an image
    data = data.reshape((n, n) + data.shape[1:]).transpose((0, 2, 1, 3) + tuple(range(4, data.ndim + 1)))
    data = data.reshape((n * data.shape[1], n * data.shape[3]) + data.shape[4:])
    plt.figure()
    plt.imshow(data,cmap='gray')
    plt.axis('off')
plt.rcParams['figure.figsize'] = (8, 8)
plt.rcParams['image.interpolation'] = 'nearest'
plt.rcParams['image.cmap'] = 'gray'

#显示conv1输出图像
 show_data(net.blobs['conv1'].data[0])
#显示conv2输出图像
show_data(net.blobs['conv2'].data[0])
##显示各层的参数信息
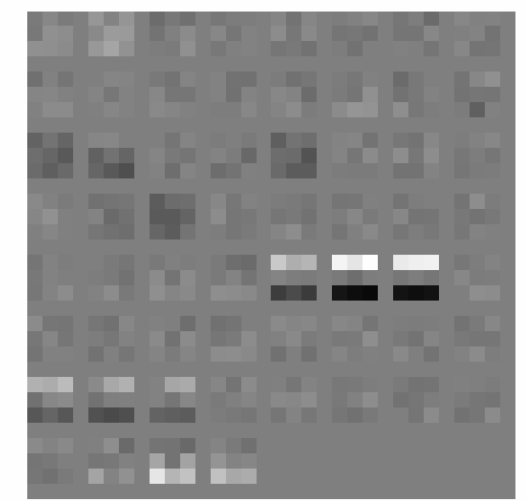
[(k, v[0].data.shape) for k, v in net.params.items()]#显示conv1所用卷积核
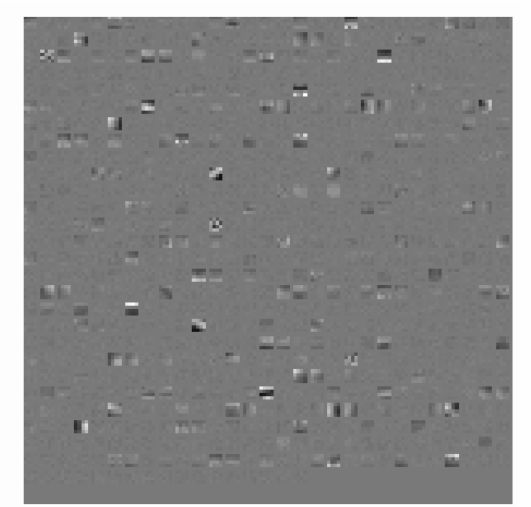
show_data2(net.params['conv1'][0].data.reshape(20*3,3,3))#显示conv2所用卷积核
show_data2(net.params['conv2'][0].data.reshape(40*20,4,4))#我这里只是用CNN提取特征,故只需要ip1输出的160维向量,
#如果需要计算概率可以在后面加上一个softmax层
out=net.blobs['ip1'].data
out.shape3.总结
训练好网络,再提取出160维的特征。至此完成内部参数可视化和模型调用,那2个显示函数是用的别人的,会使用opencv的朋友可以自己写一个更好的函数来使用。我这里就偷下懒了,后面会考虑自己写个显示的函数。
有些朋友可能训练时使用了均值文件,请点这里 http://www.cnblogs.com/denny402/p/5105911.html
