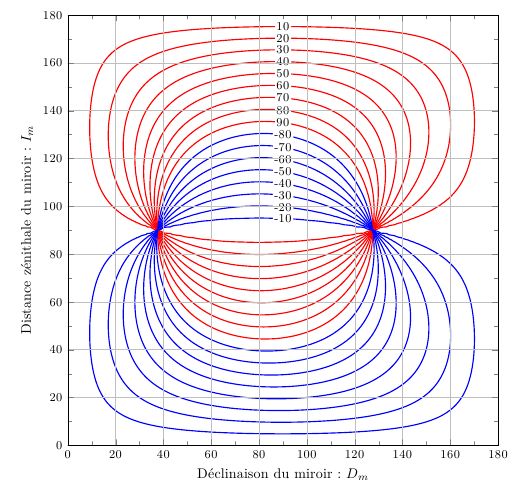
用pgfplots宏包绘制等高线并标注
http://tex.stackexchange.com/questions/62504/label-curve-and-or-contour-name-created-with-pgfplot-via-gnuplot?rq=1
\documentclass[a4paper]{article}
        \usepackage[T1]{fontenc}
        \usepackage[utf8,applemac]{inputenc}
        \usepackage{lmodern, textcomp}
        \usepackage{mathrsfs,bm}
        \usepackage{amsmath,amssymb,amscd}
        \usepackage{comment,relsize}
        \usepackage[frenchb]{babel}
        % ==============================================
        \usepackage[babel=true,kerning=true]{microtype}%pour le package tikZ et les deux points``:''
        %%% TikZ packages.
        \usepackage{pgfplots}
        \usetikzlibrary{intersections}
        %
        \pagestyle{empty}

        \pgfplotsset{compat=newest}
        % ==============================================
        \begin{document}
        % ==============================================
\pgfkeys{
    /pgfplots/linelabel/.style args={#1:#2}{
        name path global=labelpath,
        execute at end plot={
            \path [name path global = labelpositionline]
                (rel axis cs:#1,0) -- (rel axis cs:#1,1);
            \path [name intersections={of=labelpath and labelpositionline, total=\total}]
                (intersection-\total) node [fill=white,inner xsep=1pt, inner ysep=0pt, font=\small] {#2};
        }
    }
}

        \begin{tikzpicture}
        % réglage de la grille de coordonnées
        \begin{axis}
          [ grid=major,
            no markers,
            axis on top,
            tick label style={font=\small},
            %extra y tick style={grid=major},
            %extra x tick style={grid=major}
            minor y tick num=1,
            minor x tick num=1,
            %smooth,
            xlabel={D{\'e}clinaison du miroir: $D_m$},
            ylabel={Distance z{\'e}nithale du miroir: $I_m$},
            xmin=0, xmax=180,
            ymin=-0, ymax=180,
            width=1\textwidth,
            height=1\textwidth,
            legend style={at={(0.02,0.97)},anchor=north west},
            legend pos=south east,
            legend cell align=left
           ]%
        % Création des graphes f(x,y)=0 via GNUPLOT
        \pgfplotsinvokeforeach{10,20,...,90}{
            \pgfmathsetmacro\labelpos{#1/200}
            \addplot [ linelabel=0.5:#1,no markers, red, raw gnuplot, thick, empty line = jump ]%
                gnuplot {%
                    set contour base;
                    set cntrparam levels discrete 0.0000;
                    unset surface;
                    set view map;
                    set grid;
                    set isosamples 200;
                    set xrange [0:180];
                    set yrange [0:180];
                    D=pi/180*165;           %<<--------- ICI
                    I=pi/180*90;            %<<--------- ICI
                    k=tan(pi/180*#1);
                    f(x,y)= k*(cos(D) + cos((D-2*pi/180*x)) * tan(pi/180*y)**2) - 2*sin(I) * sin(pi/180*x) * tan(pi/180*y)-cos(I) * (sin(D)+sin((D-2*pi/180*x)) * tan(pi/180*y)**2);
            splot f(x,y);
            };%
         }
        %
        \pgfplotsinvokeforeach{-10,-20,...,-80}{
            \addplot [ linelabel=0.5:#1, no markers, blue, raw gnuplot, thick, empty line = jump ]%
                gnuplot {%
                    set contour base;
                    set cntrparam levels discrete 0.0000;
                    unset surface;
                    set view map;
                    set grid;
                    set isosamples 200;
                    set xrange [0:180];
                    set yrange [0:180];
                    D=pi/180*165;           %<<--------- ICI
                    I=pi/180*90;            %<<--------- ICI
                    k=tan(pi/180*#1);
                    f(x,y)= k*(cos(D) + cos((D-2*pi/180*x)) * tan(pi/180*y)**2) - 2*sin(I) * sin(pi/180*x) * tan(pi/180*y)-cos(I) * (sin(D)+sin((D-2*pi/180*x)) * tan(pi/180*y)**2);
            splot f(x,y);
            };%
         }
\end{axis}
 %
\end{tikzpicture}
% ==============================================
\end{document}

\documentclass[a4paper]{article}
        \usepackage[T1]{fontenc}
        \usepackage[utf8,applemac]{inputenc}
        \usepackage{lmodern, textcomp}
        \usepackage{mathrsfs,bm}
        \usepackage{amsmath,amssymb,amscd}
        \usepackage{comment,relsize}
        \usepackage[frenchb]{babel}
        % ==============================================
        \usepackage[babel=true,kerning=true]{microtype}%pour le package tikZ et les deux points``:''
        %%% TikZ packages.
        \usepackage{pgf,tikz}
        \usepackage{pgfplots}
        %
        \pagestyle{empty}

        \pgfplotsset{compat=newest}
        % ==============================================
        \begin{document}
        % ==============================================

        \begin{tikzpicture}
        % réglage de la grille de coordonnées
        \begin{axis}
          [ grid=major,
            no markers,
            axis on top,
            tick label style={font=\small},
            %extra y tick style={grid=major},
            %extra x tick style={grid=major}
            minor y tick num=1,
            minor x tick num=1,
            %smooth,
            xlabel={D{\'e}clinaison du miroir: $D_m$},
            ylabel={Distance z{\'e}nithale du miroir: $I_m$},
            xmin=0, xmax=180,
            ymin=-0, ymax=180,
            width=1\textwidth,
            height=1\textwidth,
            legend style={at={(0.02,0.97)},anchor=north west},
            legend pos=south east,
            legend cell align=left
           ]%
        % Création des graphes f(x,y)=0 via GNUPLOT
        \pgfplotsinvokeforeach{10,20,...,90}{
            \addplot [ contour prepared, point meta=#1, contour/label distance=10cm, contour/draw color=red,  no markers, red, raw gnuplot, thick, empty line = jump ]%
                gnuplot {%
                    set contour base;
                    set cntrparam levels discrete 0.0000;
                    unset surface;
                    set view map;
                    set grid;
                    set isosamples 200;
                    set xrange [0:180];
                    set yrange [0:180];
                    D=pi/180*165;           %<<--------- ICI
                    I=pi/180*90;            %<<--------- ICI
                    k=tan(pi/180*#1);
                    f(x,y)= k*(cos(D) + cos((D-2*pi/180*x)) * tan(pi/180*y)**2) - 2*sin(I) * sin(pi/180*x) * tan(pi/180*y)-cos(I) * (sin(D)+sin((D-2*pi/180*x)) * tan(pi/180*y)**2);
            splot f(x,y);
            };%
         }
        %
        \pgfplotsinvokeforeach{-10,-20,...,-80}{
            \addplot [ contour prepared, contour/label distance=10cm, contour/draw color=blue, point meta=#1, no markers, blue, raw gnuplot, thick, empty line = jump ]%
                gnuplot {%
                    set contour base;
                    set cntrparam levels discrete 0.0000;
                    unset surface;
                    set view map;
                    set grid;
                    set isosamples 200;
                    set xrange [0:180];
                    set yrange [0:180];
                    D=pi/180*165;           %<<--------- ICI
                    I=pi/180*90;            %<<--------- ICI
                    k=tan(pi/180*#1);
                    f(x,y)= k*(cos(D) + cos((D-2*pi/180*x)) * tan(pi/180*y)**2) - 2*sin(I) * sin(pi/180*x) * tan(pi/180*y)-cos(I) * (sin(D)+sin((D-2*pi/180*x)) * tan(pi/180*y)**2);
            splot f(x,y);
            };%
         }
\end{axis}
 %
\end{tikzpicture}
% ==============================================
\end{document}
Code for second example