jQuery EasyUI使用教程之创建数据网格的自定义视图
<jQuery EasyUI最新试用版免费下载>
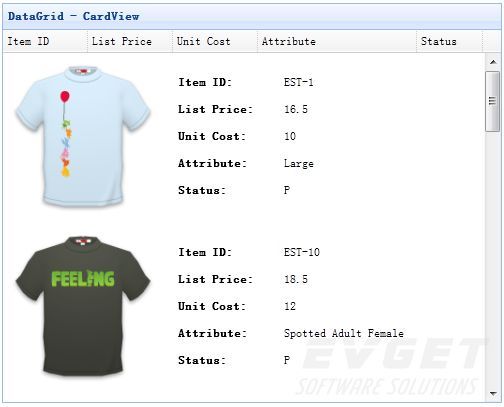
在不同的情况下,您可能需要为数据网格运用更灵活的布局,Cardview是个不错的选择。这个工具可以在数据网格中迅速获取和显示数据。在数据网格的头部,您可以仅仅通过点击列的头部来排序数据。本教程将向您展示如何创建自定义Cardview。
查看jQuery EasyUI演示
创建Card View
从数据网格的默认视图继承,是个创建自定义视图的不错方法。我们将要创建一个Card View来为每行显示一些信息。
var
cardview = $.extend({}, $.fn.datagrid.defaults.view, {
renderRow:
function
(target, fields, frozen, rowIndex, rowData){
var
cc = [];
cc.push(
'<td colspan='
+ fields.length +
' style="padding:10px 5px;border:0;">'
);
if
(!frozen){
var
aa = rowData.itemid.split(
'-'
);
var
img =
'shirt'
+ aa[1] +
'.gif'
;
cc.push(
'<img src="images/'
+ img +
'" style="width:150px;float:left">'
);
cc.push(
'<div style="float:left;margin-left:20px;">'
);
for
(
var
i=0; i<fields.length; i++){
var
copts = $(target).datagrid(
'getColumnOption'
, fields[i]);
cc.push(
'<p><span class="c-label">'
+ copts.title +
':</span> '
+ rowData[fields[i]] +
'</p>'
);
}
cc.push(
'</div>'
);
}
cc.push(
'</td>'
);
return
cc.join(
''
);
}
});
创建数据网格
现在我们使用视图创建数据网格。
<
table
id
=
"tt"
style
=
"width:500px;height:400px"
title
=
"DataGrid - CardView"
singleSelect
=
"true"
fitColumns
=
"true"
remoteSort
=
"false"
url
=
"datagrid8_getdata.php"
pagination
=
"true"
sortOrder
=
"desc"
sortName
=
"itemid"
>
<
thead
>
<
tr
>
<
th
field
=
"itemid"
width
=
"80"
sortable
=
"true"
>Item ID</
th
>
<
th
field
=
"listprice"
width
=
"80"
sortable
=
"true"
>List Price</
th
>
<
th
field
=
"unitcost"
width
=
"80"
sortable
=
"true"
>Unit Cost</
th
>
<
th
field
=
"attr1"
width
=
"150"
sortable
=
"true"
>Attribute</
th
>
<
th
field
=
"status"
width
=
"60"
sortable
=
"true"
>Status</
th
>
</
tr
>
</
thead
>
</
table
>
$(
'#tt'
).datagrid({
view: cardview
});
请注意,我们设置view属性,且它的值为我们的card view。
下载EasyUI示例:easyui-datagrid-demo.zip
有兴趣的朋友可以 点击查看更多有关jQuery EasyUI的教程!