Python 绘图/动画程序
本文放一些我写过的 Python 绘图小程序。
Penrose 铺砌
绘图的原理见这里。原代码有瑕疵,我做了修正。对三角形列表中的每个小三角形,都绘制其所在的整个菱形,这个可能是因为精度的原因,否则的话某些三角形拼接的部分会出现一条白线,这个现象用 Asymptote 画也有。
 1 #coding = utf-8
 2
 3 """
 4 菱形版本的彭罗斯铺砌.
 5
 6 这个算法的关键是搞清楚每次切割后得到的小三角形的类型. 小三角形共分2类4种, 顶角为36度的等腰三角形2种, 顶角为108度的等腰三角形2种.
 7 """
 8 import cairo
 9 import cmath
10 from math import pi,sqrt
11
12 Width, Height = 600, 600
13
14 a = (sqrt(5)-1)/2
15
16 def subdivide(triangles):
17     result = []
18     for color, A, B, C in triangles:
19         if color == 0:
20             P = A + (B - A) * a
21             result += [(0, C, P, B), (1, P, C, A)]
22         else:
23             Q = B + (A - B) * a
24             R = B + (C - B) * a
25             result += [(1, R, C, A), (1, Q, R, B), (0, R, Q, A)]
26     return result
27
28 triangles = []
29
30 for i in xrange(10):
31     B = cmath.rect(1, (2*i - 1) * pi / 10)
32     C = cmath.rect(1, (2*i + 1) * pi / 10)
33     if i%2 == 0:
34         B, C = C, B
35     triangles.append((0,0j,B,C))
36
37
38 m = input('number of divides: ')
39
40 for i in xrange(m):
41     triangles = subdivide(triangles)
42
43 surface = cairo.ImageSurface(cairo.FORMAT_ARGB32, Width, Height)
44 cr = cairo.Context(surface)
45 cr.translate(Width/2., Height/2.)
46 cr.scale(0.45*Width,0.45*Height)
47 """
48 要输出图形的矩形区域的话,将上面 cr.scale() 一行注释掉并取消下面两行的注释.
49 """
50 #WheelRadius = 1.2*sqrt((Width/2.)**2 + (Height/2.)**2)
51 #cr.scale(WheelRadius, WheelRadius)
52
53 color, A, B, C = triangles[0]
54 cr.set_line_width(abs(B - A) / 20.0)
55 cr.set_line_join(cairo.LINE_JOIN_ROUND)
56
57 """
58 在绘制每个三角形的时候, 可能由于精度之类的原因, 三角形结合的部位会出现一条空白线影响美观, 所以干脆直接绘制整个菱形. 这样会导致每个菱形被绘两次, 但是效果令人满意.
59 """
60 for color, A, B, C in triangles:
61     D = B + C - A
62     cr.move_to(A.real, A.imag)
63     cr.line_to(B.real, B.imag)
64     cr.line_to(D.real, D.imag)
65     cr.line_to(C.real, C.imag)
66     cr.close_path()
67     if color == 1:
68         cr.set_source_rgb(1.0, 0.078, 0.576)
69     else:
70         cr.set_source_rgb(0, 0.545, 0.545)
71     cr.fill_preserve()
72     cr.set_source_rgb(0.2, 0.2, 0.2)
73     cr.stroke()
74
75 surface.write_to_png('penrose_rhombi_{}.png'.format(m))
Lorenz 吸引子动画演示
程序出自这个博客,作者的代码有些地方写的不太好,我在下面的代码中作了修正。
 1 #coding = utf-8
 2 import matplotlib.pyplot as plt
 3 import numpy as np
 4 from matplotlib.animation import FuncAnimation # 动画演示
 5 from scipy.integrate import odeint  #解微分方程
 6 from mpl_toolkits.mplot3d import Axes3D
 7
 8
 9 # 绘制轨迹的个数
10 N = 20
11
12 # 参数
13 sigma, beta, rho = 10.0, 8/3.0, 28.0
14 def derivative((x,y,z),t0):
15     """返回点 (x,y,z) 处的切方向"""
16     return sigma*(y-x), x*(rho-z)-y, x*y-beta*z
17
18 def solution(x_0,t):
19     """对初始位置 x_0 和时间数组 t, 返回解在 t 的每个元素处的值
20     sicpy.odeint() 函数接受一个函数 f, 一个初始值 x_0 和一个列表 t 为参数, 返回值是 t 对应的解组成的列表.
21     f 应当为 dy/dt = f(y,t) 返回解 y 在 t 时刻的导数值.
22     """
23     return odeint(derivative,x_0,t)
24
25 x_0 = -15 + 30 * np.random.random((N,3)) # 随机生成 N 个点
26 t = np.linspace(0,4,1001)
27 x_t = np.array([ solution(z,t) for z in x_0])
28 """
29 每个点 z 的轨迹是一条空间曲线 z(t), 对区间[0,4]中的 t 计算 z(t), 把这些点连起来, 就得到了轨迹.
30
31 Example:
32 >>> x_t.shape
33 >>> (20,1000,3)
34 """
35
36 fig = plt.figure(figsize=(8,8))
37 ax = fig.gca(projection='3d',xlim=(-25,25), ylim=(-35,35),zlim=(5,55))
38 # 不要使用 add_subplot() 函数来构造 3d 实例, 上面的方式是标准的.
39 ax.view_init(30,0) #(初始视角包含 xy 平面的经度和 z 轴的纬度)
40 ax.axis('off')
41 """
42 接下来把要绘制的轨迹和小球各自放在一个列表中. 首先我们生成轨迹和球的列表, 但是先不给出具体值.
43 这里的 ax.plot() 函数返回的是一个长度为 1 的列表, 所以要用 l,=ax.plot() 的写法.
44 """
45 colors = plt.cm.jet(np.linspace(0,1,N))
46 lines = []
47 points = []
48
49 for c in colors:
50     l, = ax.plot([],[],'-',c=c)
51     p, = ax.plot([],[],'o',c=c)
52     lines.append(l)
53     points.append(p)
54
55
56 def init():
57     for line, point in zip(lines,points):
58         line.set_data([],[])
59         line.set_3d_properties([])
60
61         point.set_data([],[])
62         point.set_3d_properties([])
63     return lines + points
64
65 def animate(i):
66     i = (2*i) % x_t.shape[1]  # 调整轨迹运动的速度, 否则太慢了
67     for line, point, x_j in zip(lines,points,x_t):
68         x,y,z = x_j[:i].T
69
70         line.set_data(x,y)
71         line.set_3d_properties(z)
72
73         point.set_data(x[-1:],y[-1:i])
74         point.set_3d_properties(z[-1:i])
75     ax.view_init(30, 0.3*i)
76     fig.canvas.draw()
77     return lines + points
78 """
79 这里要把 x_j 当前的端点画出来, 这个点坐标就是 a,b,c = x_j[i], 因此这里也可以写成
80 point.set_data([a],[b])
81 point.set_3d_properties([c])
82 其中 a,b,c 分别是 x_j[i] 的 3 个坐标. 由于 plot() 接受列表为参数, 因此要加 [].
83 试比较 x[-1] 与 x[-1:] 的区别:
84 >>> x =[1,2,3]
85 >>> x[-1]
86 >>> 3
87 >>> x[-1:]
88 >>> [3]
89 """
90
91 anim = FuncAnimation(fig,animate,init_func=init,frames=500,interval=30,blit=True)
92 #plt.show()
93 anim.save('Lorenz.mp4')
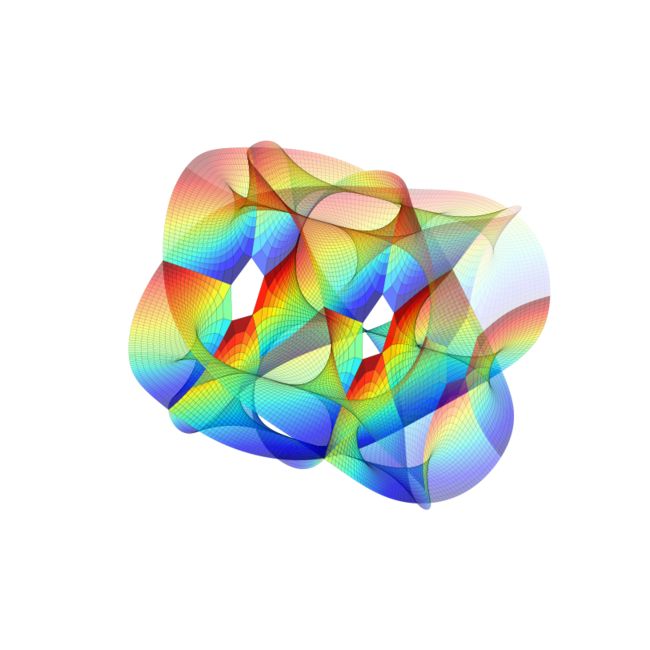
Calabi - Yau 流形
 1 #coding=utf-8
 2 import numpy as np
 3 from numpy import exp, pi, sinh, cosh,sin, cos
 4 import matplotlib.pyplot as plt
 5 from mpl_toolkits.mplot3d import Axes3D
 6
 7 fig = plt.figure(figsize=(8,8))
 8 ax = fig.gca(projection='3d',xlim=(-1,1),ylim=(-1,1),zlim=(-1,1),aspect=1)
 9 ax.axis('off')
10
11 x = np.linspace(-1,1,30)
12 y = np.linspace(0,0.5*pi,30)
13 X,Y = np.meshgrid(x,y)
14 n = 5
15 alpha = 0.5 * pi
16
17 def CalabiYau(z,k1,k2):
18     z1 = exp(2*pi*1j*k1/n) * cosh(z)**(2.0/n)
19     z2 = exp(2*pi*1j*k2/n) * sinh(z)**(2.0/n)
20     return np.array([z1.real, z2.real, cos(alpha)*z1.imag+sin(alpha)*z2.imag])
21
22 for k1 in range(n):
23     for k2 in range(n):
24         Z = CalabiYau(X+Y*1j,k1,k2)
25         surface = ax.plot_surface(Z[0],Z[1],Z[2],rstride=1,cstride=1,lw=0.1,cmap='hsv')
26
27 plt.show()
28 #fig.tight_layout()
29 #plt.savefig('Calabi_Yau_Manifold.png')

