LoG, DoG, Pyramid 与SIFT 算法
本文写的很乱, 没什么层次和结构. 每天都更新一点, SIFT2004这篇捋完会重新排版
为了不改变原意, 不少地方都用了英文 , 大段英文可以不看, 只要看加颜色的就行.争取覆盖所有细节
--------------------------------
http://crcv.ucf.edu/videos/lectures/2012.php
视频的主要内容是讲SIFT-----Scale Invariant Feature Transformation
这里面lecture05 我看了两遍都看不明白, 有些内容前几课并没有讲,
所以这里把需要的知识讲一讲
LoG--------------Laplacian of Gaussian
Laplacian 我在这篇文章上提过一嘴http://blog.csdn.net/traumland/article/details/51077236
我记得说过LoG, 原文找不到了![]()
上课件http://www.cse.psu.edu/~rtc12/CSE486/ , lecture11,
注:下面截图均来自本课件和上面提到的视频 , 公式均来自 Lowe,2004
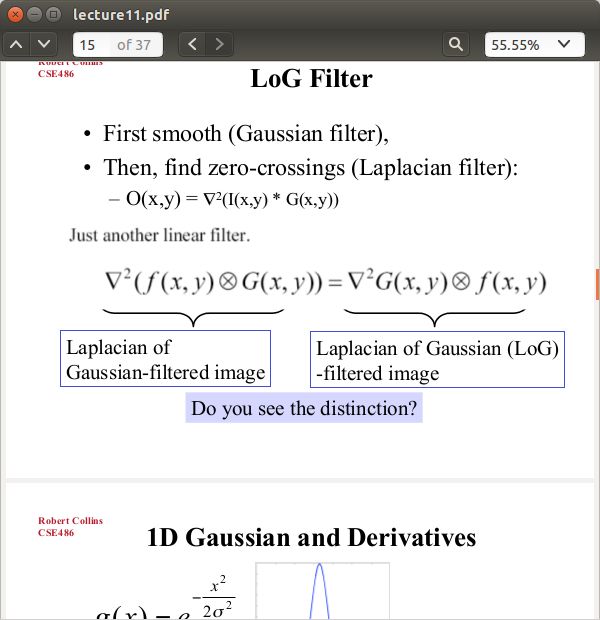
对图像求Laplacian, 然后Gaussian 与
对Gaussian求Laplacian,然后对图像求Laplacian of Gaussian
是一样的, 因为卷积计算具有交换律
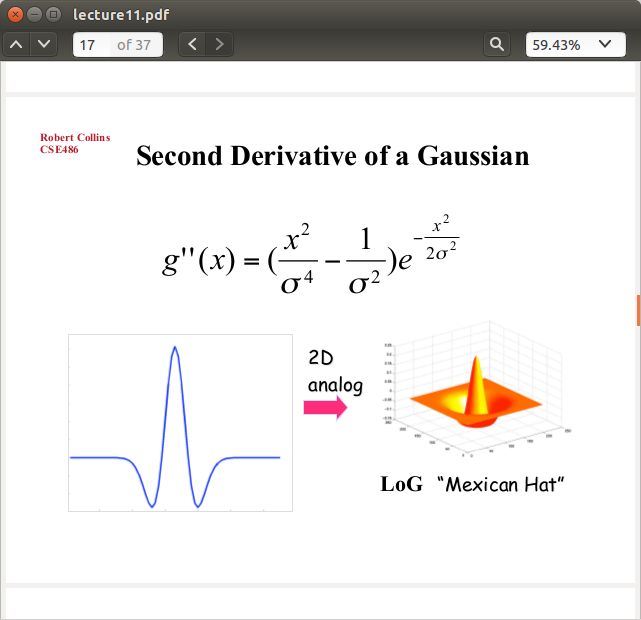
对Gaussian求Laplacian是这样的
这就是LoG
DoG - ---------------------Difference of Gaussian
如图, DoG = Gσ1 - Gσ2 , 与LoG近似
lecture 10 : Pyramids and Scale Space
先回忆下Gaussian 的性质
做个题加深一下理解
就按上面的公式往里面代, 都能求出来的
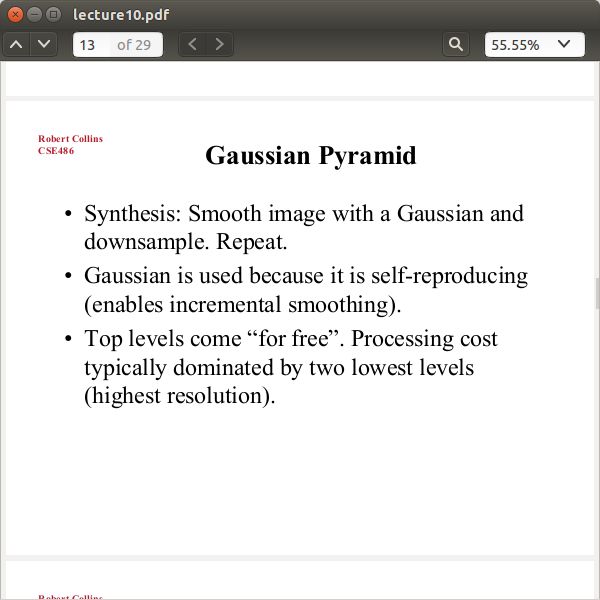
Gaussian Pyramid
scale 就先按Gaussian的 σ 的不同来理解吧
到现在, 需要的内容就差不多了
下面讲讲SIFT
先上论文两篇
Object recognition from local scale-invariant features
http://www.cs.ubc.ca/~lowe/papers/iccv99.pdf
与
Distinctive Image Features from Scale-Invariant Keypoints
http://www.cis.rit.edu/~cnspci/references/dip/feature_extraction/lowe2004.pdf
其中2004年这个必看, 讲的很明白, 比我提到的那个视频还详细
怪不得视频里老师总是说让去看看论文就明白了, 提了好几次
看过论文我都后悔写这篇文章了!!不过论文好难啃, 姑且就算翻译了
话说视频里面的PPT直接抄人家的图, 这样好吗
晚上把opencv例程弄出来
-----------------------------------------
这几天没有弄这个程序, 还是再大概说一下SIFT吧, 我会尽量覆盖到每一个点
2004年这个20页的内容也蛮多的, 一口气看不完容易给人挫败感
从开头捋起
Earlier work by the author (Lowe, 1999) extended the local feature
approach to achieve scale invariance.(这句是说他前面这篇文章Object recognition from local scale-invariant features下载链接在前面)
这篇文章提供了更深入的研究与分析, 并且提供了一些关于稳定性与特征不变性的一些改进
检测keypoint的第一个阶段就是在不同角度观测下确定locations和scales, 使这两个参数可以重复的使用(assigned)
Detecting locations that are invariant to scale change of the image方法用的是下面链接给出的这篇
http://people.csail.mit.edu/torralba/courses/6.869/lectures/lecture11/witkin.pdf
接下来这句话解释了为什么用Gaussian
It has been shown by Koenderink (1984) and Lindeberg (1994)
that under a variety of reasonable assumptions the only possible scale-space kernel is
the Gaussian function.
然后定义了L(x, y, σ ) = G(x, y, σ ) ∗ I (x, y) , 其中G(x, y, σ ) 为高斯函数 I (x, y)为图像的函数
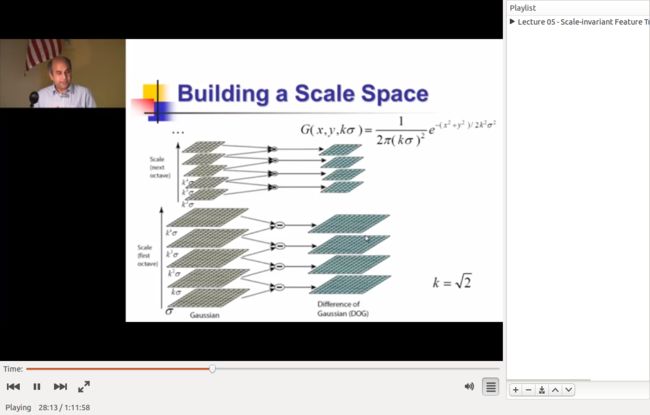
接着介绍了LoG, 用DoG简化计算, 说用DoG的益处
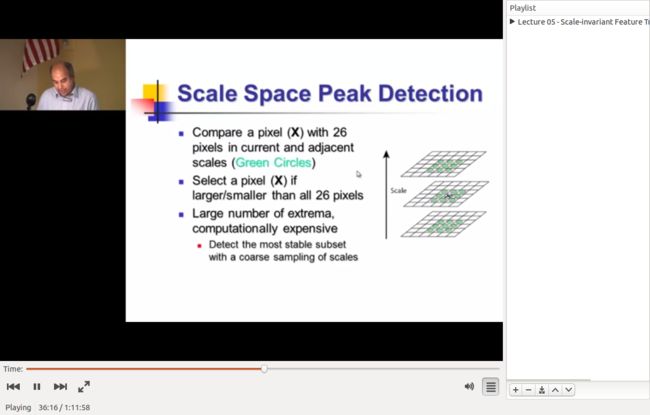
论文的图片不太详细, 这里上个前面视频的截图
In order to detect the local maxima and minima of D(x, y, σ ),
each sample point is compared to its eight neighbors in the current image
and nine neighbors in the scale above and below
It is selected (local extrema)only if it is larger than all of these neighbors or smaller
than all of them.
接着给出了三张图表, 然后论证论文中使用参数的合理性
Fig.3 第一张图表 显示当scale为3, repeatability达到顶点
第二张图表 显示scale越大, 得到的keypoint越多
总的来说keypoint越多匹配越好, 但是因为scale越大, 计算量越大, 而repeatability在下降
综合考虑这篇论文选择scale为3
Fig.4 显示 σ 越大, repeatability 越高
出于效率的考虑, σ = 1.6 , 这个值接近最优repeatability(兼顾效率)
Of course, if we pre-smooth the image before extrema detection,
we are effectively discarding the highest spatial frequencies.
Therefore, to make full use of the input, the image can be expanded
to create more sample points than were present in the original.
We double the size of the input image using linear interpolation
prior to building the first level of the pyramid. While the equivalent
operation could effectively have been performed by using sets of
subpixel-offset filters on the original image, the image doubling leads
to a more efficient implementation. We assume that the original image
has a blur of at least σ = 0.5 (the minimum needed to prevent significant
aliasing), and that therefore the doubled image has σ = 1.0 relative to
its new pixel spacing. This means that little additional smoothing is
needed prior to creation of the first octave of scale space. The image
doubling increases the number of stable keypoints by almost a factor of 4,
but no significant further improvements were found with a larger expansion factor.
Once a keypoint candidate has been found by comparing a pixel to its neighbors,
the next step is to perform a detailed fit to the nearby data for location, scale,
and ratio of principal curvatures.This information allows points to be rejected
that have low contrast (and are therefore sensitive to noise) or are poorly localized
along an edge.(不好意思对不了解的东西不太想斟酌怎么翻译, 怕改变了意思, 故献上原文)
接着给了一个泰勒公式的扩展式, 令D(x) 对x 的一阶导为0 , 然后给出了x的表达式
相关公式的推导: http://dsp.stackexchange.com/questions/10403/sift-taylor-expansion
----------------
当偏置向量 x 不管三维元素中哪个大于0.5, 就说明当前的采样点不是extrema,
extrema应该是是当前采样点(x, y , sigma)加上 x .
用D(x)的值来排除不稳定的extrema with low contrast(低对比度).
本文中 D(x) 小于 0.03 均被舍弃.(as before, we assume image pixel values in the range[0, 1])
但是光排除extrema with low contrast 还不够.
即使edge的位置不容易确定下来(is poorly determined ),
在edge附近DoG的response(response可以理解为DoG值?)也很大, 并且(DoG)因此对少数噪声也不稳定.
一个定义不好的 peak in the difference-of-Gaussian在横跨边缘的地方有较大的主曲率( principal curvature),
而在垂直边缘的方向有较小的主曲率。
(主曲率https://en.wikipedia.org/wiki/Principal_curvature)
主曲率可以通过一个2×2 的Hessian矩阵H求出:
导数由采样点相邻差估计得到。H的特征值与D的主曲率成正比
Borrowing from the approach used by Harris and Stephens (1988), we can avoid explicitly
computing the eigenvalues, as we are only concerned with their ratio.
令α为较大特征值,β为较小的特征值,则迹和行列式可以由下取得

有一种不太可能的情况, 就是当行列式为负时, 曲率的符号不同,
所以此时被计算点不能判定为extrema. 令α = rβ
故hessian矩阵的迹与行列式的比值之和 r 有关, 即特征值之间的比值
因此, 检查主曲率是否小于某个threshold, r , 只需要检查 ![]()
The experiments in this paper use a value of r = 10,which eliminates keypoints
that have a ratio between the principal curvatures greater than 10
效果如Fig.5 c,d 所示
指定方位
当指定了一个方位时, keypoint descriptor 可以表示为相对这个方位的方向,
这样就达到了图像的旋转不变性.
keypoint的scale是用来选择最接近这个scale的、经过gaussian平滑过的图像,
所以所有的计算都是以scale-invariant(尺度不变性)的方式实行的. 对于每个image sample L(x,y)
(经过高斯平滑的图像) , 在这个scale下, 梯度大小m(x, y), 方向θ (x, y),
均由 pixel differences(翻译成像素的不同恐怕不妥) 计算得到的.
其中
在keypoint附近区域建立采样点梯度方向的orientation histogram(方位直方图)
直方图有36组, 对应方向的360度(Each sample added to the histogram is weighted by its gradient
magnitude and by a Gaussian-weighted circular window with a σ that is 1.5 times that of the scale of the keypoint.)
直方图的顶点对应局部梯度的主要方向,其他的达到peak 80%的地方也产生以该方向的keypoint.
所以, 对于相同大小的多peak 的局部区域, 会产生在这相同的区域(location)和相同尺度(scale)
不同方向的多个keypoint. 虽然这种multiple orientations的点只有大概15%, 但是这些点对匹配的
稳定性贡献很大.最后, 为了更加准确 , 用一个抛物线去拟合最接近peak的三个histogram值
插值得到peak的位置( to interpolate the peak position) .
Fig.6显示的是噪音对SIFT的repeatability的影响, 显示SIFT对噪音有较高的容忍度
