d3.js——直方图的绘制及过去知识点的结合
//随机生成数据
var rand = d3.random.normal(0,25)
var dataset = [];
for (var i = 0;i <100;i++){
    dataset.push(rand());
}
一、直方图数据转换函数:
//数据转换
var bin_num = 15
var histogram=d3.layout.histogram()
    .range([-50,50]) //区间范围
    .bins(bin_num) //分隔数
    .frequency(true)//true:统计个数;false:统计概率
var data = histogram(dataset);
console.log (data)
二、开始绘制:
var svg = d3.select("body").append("svg")
    .attr("width",600)
    .attr("height",600)
var color = d3.scale.category20();
1、定义比例尺
var max_height = 400,
    rect_step = 30,//直方图间距
    heights = [];
for (var i = 0;i<data.length;i++){
    heights.push(data[i].y)
}
var scale_y = d3.scale.linear()
    .domain([d3.min(heights),d3.max(heights)])
    .range([0,max_height])
2、绘制图形
var graphics = svg.append("g")
    .attr("transform","translate(30,20)");
(1)绘制矩形并加入动画效果
graphics.selectAll("rect")
    .data(data)
    .enter()
    .append("rect")
    .attr("y",function(d,i){
        return 300
    })//动画开始的y值
    .attr("height",0)//动画开始高度
    .attr("fill","red")//动画开始颜色
    .transition()//实现动态效果函数
    .duration(3000)//指定整个转变持续的时间,单位为毫秒
    .ease("bounce")//指定转变的方式,linear:普通的线性变化;circle:慢慢地到达变换的最终状态;elastic带有弹跳的到达最终状态;bounce在最终状态处弹跳几次.
    .delay(function(d,i){
        return 200*i;
    })//指定延迟的时间,表示一定时间后才开始转变,单位同样为毫秒
    .attr("x",function(d,i){return i*rect_step})
    .attr("y",function(d,i){return max_height - scale_y(d.y)})
    .attr("width",function(d,i){return rect_step-2})
    .attr("height", function (d) {
        return scale_y(d.y)
    })
    .attr("fill",color)
<pre name="code" class="javascript">//添加鼠标事件
var rect = graphics.selectAll("rect")
    .on("mouseover",function(d,i){
        d3.select(this)
            .attr("fill","yellow")
    })
    .on("mouseout",function(d,i){
        d3.select(this)
            .attr("fill",color)
    })
(2)绘制带有箭头的坐标轴
//绘制箭头
var defs = svg.append("defs")
var arrowMarker = defs.append("marker")
    .attr("id","arrow")
    .attr("markerUnits","strokeWidth")
    .attr("markerWidth",30)
    .attr("markerHeight",30)
    .attr("viewBox","0 0 20 20")
    .attr("refX",6)
    .attr("refY",6)
    .attr("orient","auto")
var arrow_path = "M2,2 L10,6 L2,10 L6,6 L2,2";
arrowMarker.append("path")
    .attr("d",arrow_path)
    .attr("fill","#000")
//绘制横轴、纵轴并添加箭头
graphics.append("line")
    .attr("stroke","black")
    .attr("stroke-width","1px")
    .attr("x1",0)
    .attr("y1",max_height)
    .attr("x2",data.length*rect_step)
    .attr("y2",max_height)
    .attr("marker-end","url(#arrow)")
graphics.append("line")
    .attr("stroke","black")
    .attr("stroke-width","1px")
    .attr("x1",0)
    .attr("y1",max_height)
    .attr("x2",0)
    .attr("y2",0)
    .attr("marker-end","url(#arrow)")
//绘制坐标轴的分隔符直线
graphics.selectAll(".linetick")
    .data(data)
    .enter()
    .append("line")
    .attr("stroke","black")
    .attr("x1",function(d,i){return i*rect_step+rect_step/2})
    .attr("y1",max_height)
    .attr("x2",function(d,i){
        return i*rect_step+rect_step/2
    })
    .attr("y2",max_height+5)
(3)添加文字
graphics.selectAll("text")
    .data(data)
    .enter()
    .append("text")
    .attr("font-size","10px")
    .attr("x",function(d,i){
        return i * rect_step;
    })
    .attr("y", function(d,i){
        return max_height;
    })
    .attr("dx",rect_step/2 - 8)
    .attr("dy","15px")
    .text(function(d){
        return Math.floor(d.x);
    });
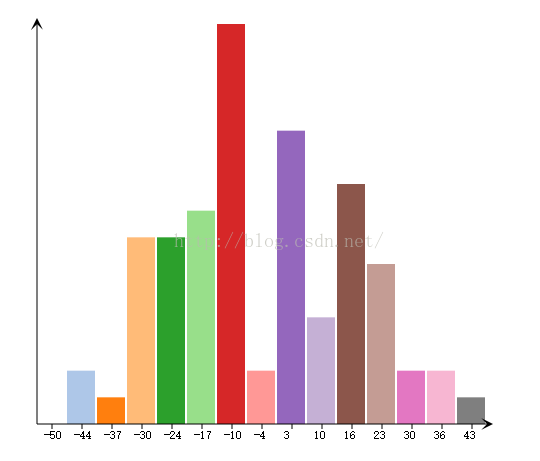
效果如下:
