Xcode高级调试技巧3
Today I am going to talk about
advanced debugging techniques in XCode. I am not going to spend much time on explaining the different options that you can find in the IDE, how to set breakpoints, or stuff like that. You can find basic techniques in many resources on the Internet.
But before starting, I want to remark two things:
- This is a real example, where the standard breakpoints and console outputs are not enough to detect where the bug is. I haven’t activated the Exception Breakpoint because this option sometimes destroys the only information we have of the stack trace. My suggestion is to give it a try, but if you can not find your bug with it then disable it and continue reading this post. You will find a different way of debuging and you need as much information as possible.
- There are many debugging techniques. Do not blame me if I am doing something in a way slightly more difficult or different to “your way”. It is not a guide of how to do it right, but how to get the information we need in some easy steps.
So, having said that, let's start!
1. Reproducing the bug and first inspection
First thing to do when debugging is
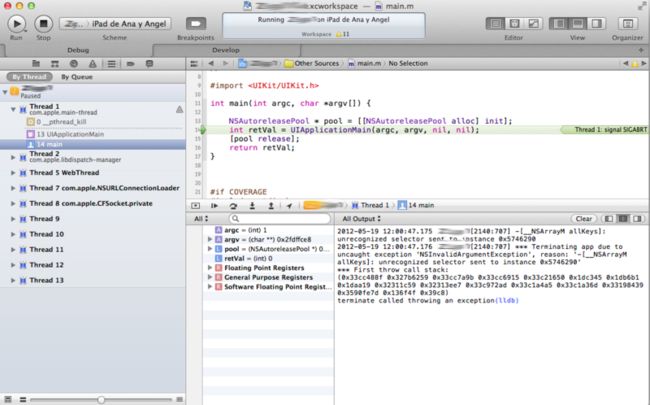
being able to reproduce the bug and inspect the error. In this case, this is what I get when running my app.
Screenshot 1
As you can see, there is not much information, but some ideas:
- The console shows that the problem is caused because we are calling the method “allKeys” on aNSArray, which is not part of it. Sometimes the method name is rare enough to look for it on the source code and find where the bug is, but not in this case because it is too generic.
- The trace on the left panel doesn’t show the line of code where the error occurred. There are many causes for it, but it is very common when you work with blocks and asynchronous tasks. This is not going to help us much.
At this point, we need to dig inside the previous information if we want a hint about the bug. Let's first take a look to the object which produced the error to see if we can guess where it comes from. Just type “
po objectName/address” on the console:
(lldb) po 0x5746290
(int) $0 = 91513488 <__NSArrayM 0x5746290>(

)
No luck! an empty array!
And what about the backtrace? let's take a look at it by typing “
bt”
(lldb) bt
* thread #1: tid = 0x1c03, 0x36f6032c libsystem_kernel.dylib`__pthread_kill + 8, stop reason = signal SIGABRT
    frame #0: 0x36f6032c libsystem_kernel.dylib`__pthread_kill + 8
    frame #1: 0x330c620e libsystem_c.dylib`pthread_kill + 54
    frame #2: 0x330bf29e libsystem_c.dylib`abort + 94
    frame #3: 0x307b7f6a libc++abi.dylib`abort_message + 46
    frame #4: 0x307b534c libc++abi.dylib`_ZL17default_terminatev + 24
    frame #5: 0x327b6356 libobjc.A.dylib`_objc_terminate + 146
    frame #6: 0x307b53c4 libc++abi.dylib`_ZL19safe_handler_callerPFvvE + 76
    frame #7: 0x307b5450 libc++abi.dylib`std::terminate() + 20
    frame #8: 0x307b6824 libc++abi.dylib`__cxa_rethrow + 88
    frame #9: 0x327b62a8 libobjc.A.dylib`objc_exception_rethrow + 12
    frame #10: 0x33c1a50c CoreFoundation`CFRunLoopRunSpecific + 404
    frame #11: 0x33c1a36c CoreFoundation`CFRunLoopRunInMode + 104
    frame #12: 0x33198438 GraphicsServices`GSEventRunModal + 136
    frame #13: 0x3590fe7c UIKit`UIApplicationMain + 1080
    frame #14: 0x00136f4e XXXX`main + 70 at main.m:14
No luck either! The information dumped is the same that the one shown on the left sidebar. Nothing interesting rather than system calls!
2. Disassembling the code
By following the previous steps you usually get enough information to find the bug. However, in this case it is not enough. So, what’s next? Up to this point, we have to go deeper in our search. What we want to find is the line of code that produced the exception, and even if we don’t know it yet, it is right there, in front of our eyes. Take a look again to the error printed on the console (
Screenshot 1):
As you can see, the first 5 numbers are similar, all of them in the range of 0x32-0x33. Then, the following 3 numbers are in a different range (0x1d), and after that again the first range of 0x32-0x33 until the last 3 numbers which seem different.
What is all this? well, they may seem random numbers, but they are not. In fact, all of them are
references to code lines in the binary, a trace of our execution stack.
The first group of numbers are references to the iOS frameworks, the second group of them to our source-code, the third one back again to the iOS, and so on.
The first group of numbers are references to the iOS frameworks, the second group of them to our source-code, the third one back again to the iOS, and so on.
So, ok, we have the line references. If we assume that the iOS frameworks have no bugs, the
last executed line in our code is the
0x1dc345. It seems a good starting point to check out, but how?
Well, in GDB we had an amazing “
info” command that gave us the source file and line number in our code, but it is not longer available in LLVM. If we inspect the LLVM help, we can find another command that looks very similar to what we are looking for: “
source info”.
Unfortunately, by running this command in the current version of XCode (4.3.2) we get this annoying message:
(lldb) source info 0x1dc345
error: Not yet implemented
WTF!!! But wait, there is another command. It is called “
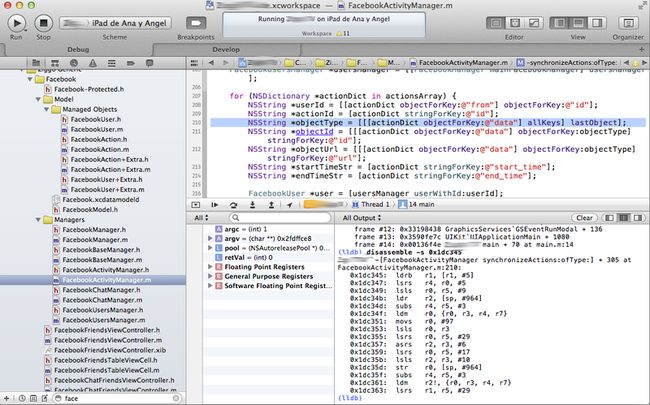
disassemble” and might also help us! Let's run it:
(lldb) di -s 0x1dc345
XXXX`-[FacebookActivityManager synchronizeActions:ofType:] + 305 at FacebookActivityManager.m:210:
   0x1dc345:  ldrb   r1, [r1, #5]
   0x1dc347:  lsrs   r4, r0, #5
   0x1dc349:  lsls   r0, r5, #9
   0x1dc34b:  ldr    r2, [sp, #964]
   0x1dc34d:  subs   r4, r5, #3
   0x1dc34f:  ldm    r0, {r0, r3, r4, r7}
   0x1dc351:  movs   r0, #97
   0x1dc353:  lsls   r0, r3
   0x1dc355:  lsrs   r0, r5, #29
   0x1dc357:  asrs   r2, r3, #6
   0x1dc359:  lsrs   r0, r5, #17
   0x1dc35b:  lsls   r2, r3, #10
   0x1dc35d:  str    r0, [sp, #964]
   0x1dc35f:  subs   r4, r5, #3
   0x1dc361:  ldm    r2!, {r0, r3, r4, r7}
   0x1dc363:  lsrs   r1, r5, #29
This is exactly what we wanted! Ignoring the dumped assembler code, we have a
reference to a source line in our code! “ FacebookActivityManager.m:210”
We check out the indicated line, and it actually makes an " allKeys" operation with something that comes from Facebook and has not been validated! this is clearly the problem!
Isn’t that amazing??? let's continue!!
3. Fixing the bug
OK, we have the problem detected, so we could actually just place an if-statement to check that the data object is a NSDictionary and protect it from crashing. That’s all, right? wrong!
There is still something strange about it. In this snippet of code we expect Facebook to reply always with an NSDictionary in our app, so we should try to see why sometimes gives a different data structure.
It could be related to another bug in our code which sends incorrect data to Facebook.
So, what can we do now?
Well, the first idea is setting a breakpoint in it and inspect the data. However, we have hundreds of “actions” in our example, and just a few of them (maybe one) fails. It could take forever to find it!
The second idea is putting the if-statement and place a breakpoint in it to check only the incorrect ones. Even if it is perfectly fine for this example, it requires modifying the code, which sometimes could mean changing how is produced. We should always
try to change as little as possible when debugging, including NSLogs, variables, conditions,...
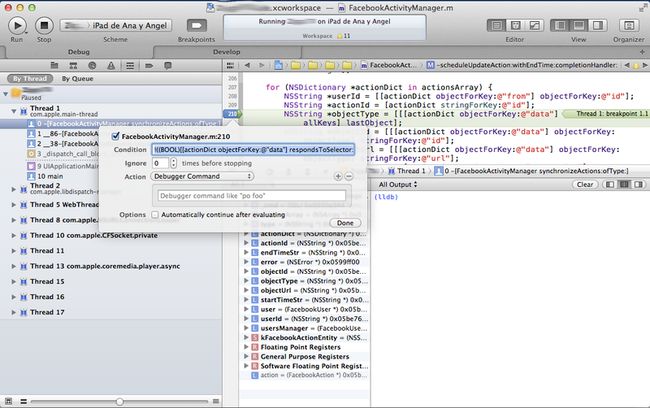
So, I am going to do it with a breakpoint, like the first idea, but with a special
stop condition that will only be true when the data is incorrect. This approach will do the trick
without modifying any code and will give as the
possibility to change the conditions on runtime if needed. This is possible in XCode by editing the breakpoint as follows:
where the stop condition in our case is:
!((BOOL)[[actionDict objectForKey:@"data"] respondsToSelector:@selector(allKeys)])
This will tell the debugger to stop only when the condition is true, and therefore when our data is invalid.
By the way, we are not going to use them in this example, but some of the breakpoint options are really worthy to take a look at. Especially, the combination between the “action” and the “automatically continue” checkbox can help us a lot when debugging complicated code. You should take a look to them if they are new for you (when you finish with this post of course hehehe).
We run it again and we get the following information from the actionDict:
(lldb) po actionDict
(NSDictionary *) $82 = 0x05be73d0 {
    application =     {
        id = 00000000000001;
        name = xxxxxx;
    };
    comments =     {
        count = 0;
    };
    data =     (
    );
    "end_time" = "2012-04-03T09:16:17+0000";
    from =     {
        id = 100003278335919;
        name = "Tester Xaton";
    };
    id = 184349868350956;
    likes =     {
        count = 0;
    };
    "publish_time" = "2012-04-03T09:16:17+0000";
    "start_time" = "2012-04-03T09:16:17+0000";
}
Well, I am pretty sure that this will not say a lot to you with the information exposed in this post about the app, but in fact I can assure you that thanks to this trace (and a couple more) I actually found another bug within the Facebook integration, the one that caused the incorrect data to be sent. It is a different topic that involves server side, so I am not going to continue there, but I wanted to point out the importance of debugging the problems until you find the root cause, not just fixing it in your breaking line. If we had stopped when fixing the problem and not continued investigating why the empty data was there, I would not have found the real bug until later, when it would have been more difficult to solve without a doubt. Always continue until the real root cause!!
4. The code fixed
    FacebookUsersManager *usersManager = [[FacebookManager mainFacebookManager] usersManager];
    for (NSDictionary *actionDict in actionsArray) {
        if (([[actionDict objectForKey:@"data"] isKindOfClass:[NSDictionary class]]) &&
            ([[actionDict objectForKey:@"from"] isKindOfClass:[NSDictionary class]])){

            NSString *userId = [[actionDict objectForKey:@"from"] objectForKey:@"id"];
            NSString *actionId = [actionDict stringForKey:@"id"];
            NSString *objectType = [[[actionDict objectForKey:@"data"] allKeys] lastObject];
            NSString *objectId = [[[actionDict objectForKey:@"data"] objectForKey:objectType] stringForKey:@"id"];
            NSString *objectUrl = [[[actionDict objectForKey:@"data"] objectForKey:objectType] stringForKey:@"url"];
            NSString *startTimeStr = [actionDict stringForKey:@"start_time"];
            NSString *endTimeStr = [actionDict stringForKey:@"end_time"];

            FacebookUser *user = [usersManager userWithId:userId];
            if (user) {
                FacebookAction *action = [self actionWithId:actionId];
                if (!action) {
                    action = [NSEntityDescription insertNewObjectForEntityForName:kFacebookActionEntity
                                                           inManagedObjectContext:self.managedObjectContext];
                    action.fbID = actionId;
                }
                action.user = user;
                action.type = type;
                action.startTime = [self.dateFormatter dateFromString:startTimeStr];
                action.endTime = [self.dateFormatter dateFromString:endTimeStr];
                action.objectType = objectType;
                action.objectFbID = objectId;
                action.objectUrl = objectUrl;
            }
        }
    }


