D3.js初体验 —— 线型图表与坐标轴的绘制
我们先来说一下利用D3来绘制线型图表与坐标轴的思路:
1、定义图表容器:container
2、定义一些数据来生成数据曲线
3、给图表添加坐标轴,包括文字
接下来就开始干活吧!
创建好HTML文件d3Test.html:
<pre style="font-family: 宋体; font-size: 9pt; background-color: rgb(255, 255, 255);"><pre name="code" class="html"><pre name="code" class="html"><!DOCTYPE html>
<html lang="en">
<head>
    <meta charset="UTF-8">
    <title>D3 Test!</title>
    <link rel="stylesheet" href="style/d3Style.css" media="screen" type="text/css"/>
</head>
<body>
<div id="container"></div>
//注意:这里提供了两种导入d3.js文件的方法:①直接导入;②导入本地的d3.js文件
<!--<scriptsrc="http://d3js.org/d3.v2.js"></script>-->
<script src="js/d3.js"></script>
<script src="js/d3Test.js"></script>
</body>
</html>
在JS文件d3Test.js文件中进行主要操作:
var width = 500,
    height = 200,
margin = {left:50,top:30,right:20,bottom:20},
g_width = width-margin.left-margin.right,
g_height = height-margin.top-margin.bottom;

//svg
var svg = d3.select("#container")
.append("svg")
//属性:宽、高
    .attr("width",width)
    .attr("height",height)

//g元素
var g = d3.select("svg")
    .append("g")
    .attr("transform","translate("+margin.left+","+margin.top+")")
var data = [1,3,5,7,8,4,3,7]

//设置比例缩放
var scale_x = d3.scale.linear()
    .domain([0,data.length-1]) //输入范围(定义域),横坐标显示有几个数据则为几个数
    .range([0,g_width])
var scale_y = d3.scale.linear()
    .domain([0,d3.max(data)])
    .range([g_height,0])//输出范围(值域),g_height 表示的是当数据为最大值即“8”的时候,输出最高点为g_height。这里要注意由于浏览器从左到右、从上到下的坐标系数值是逐渐增到,因此我们将range的值设成[g_height,0]即可实现整一个的翻转

//绘制曲线
var line_generator = d3.svg.line()
    .x(function(d,i){
        return scale_x(i);
    })
    .y(function(d){
        return scale_y(d);
    })
    .interpolate("cardinal");

d3.select("g")
    .append("path")
    .attr("d",line_generator(data))

//添加坐标轴函数:axis()
var x_axis = d3.svg.axis().scale(scale_x),
    y_axis = d3.svg.axis().scale(scale_y).orient("left");

//依次添加X、Y坐标轴,并通过偏移量的设置使得X坐标轴往下移
g.append("g")
    .call(x_axis)
    .attr("transform","translate(0,"+g_height+")")
g.append("g")
    .call(y_axis)
    .append("text")
    .text("Price($)")
    .attr("transform","rotate(-90)")
    .attr("text-anchor","end")
    .attr("dy","1em")
#container{
    background-color: #ddd;
    width: 500px;
    height: 250px;
}
path{
    fill: none;
    stroke: #4682B4;
    stroke-width: 2 ;
}
.domain,.tick line{
    stroke: gray;
    stroke-width: 1;
}
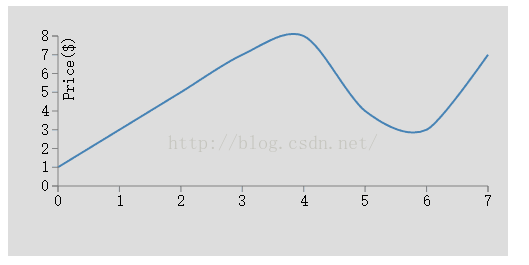
结果如下图:
这里用到了最常见的线性函数scale ,其他还有 sqrt ,pow,log,quantize,ordinal 等等各种 scale。
需要用的时候https://d3js.org/ 查询API。
