Adaboost实现二分类

作者:金良([email protected]) csdn博客: http://blog.csdn.net/u012176591
分类效果图:
做图代码:
def data2loc(x,y,data):
    dx = x[1]-x[0]
    dy = y[1]-y[0]
    xloc = (data[0]-x[0])/dx
    yloc = (data[1]-y[0])/dy

    return (xloc,yloc)
data2loc(x,y,(x[-1],y[-1])) #99.0 99.0

n=100
mx = np.max(datas,axis=0)
mn = np.min(datas,axis=0)
delta = (mx - mn)*0.05
x = np.linspace(mn[0]-delta[0],mx[0]+delta[0],n)
y = np.linspace(mn[1]-delta[1],mx[1]-delta[1],n)
xx,yy = np.meshgrid(x,y)
zz = np.zeros((n,n))
for i in range(n):
    for j in range(n):
        zz[i,j] = toClassify(baseclassifier,np.array([xx[i][j],yy[i][j]]))

gci = plt.imshow(zz,origin='lower',alpha = 0.8)

for i,label in enumerate(labels):
    loc = data2loc(x,y,datas[i])
    loc =  np.array(loc).astype(int)
    if i == 7:
        continue
    if label == -1:
        plt.plot(loc[0],loc[1],'rs',markersize = 8)
    else:
        plt.plot(loc[0],loc[1],'k.',markersize = 10)
plt.axis([0,100,0,100])
plt.xticks([0,99],[0.5,2.3])
plt.yticks([0,99],[0.5,2.2])
plt.title(u'AdaBoost二分类效果图',{'fontname':'STFangsong','fontsize':18})
savefig('adaboostbinary.png',dpi=700,bbox_inches='tight')
载入数据集函数
def loadData():
    datas = np.array([[1.0,2.1],[2,1.1],[1.3,1],
                      [1.0,1.0],[2.3,1.3],[0.5,0.8],
                      [0.8,1.5],[1.9,2.2],[1.7,1.5],
                      [1.5,1.7],[1.5,0.5],[1.2,1.6],
                      [1.8,1.1],[1.2,0.9],[1.7,2.0],
                      [1.2,0.5],[2.0,1.2]])
    labels = np.array([-1,-1,1,1,-1,-1,1,1,-1,1,1,-1,-1,1,1,-1,1])

    return datas,labels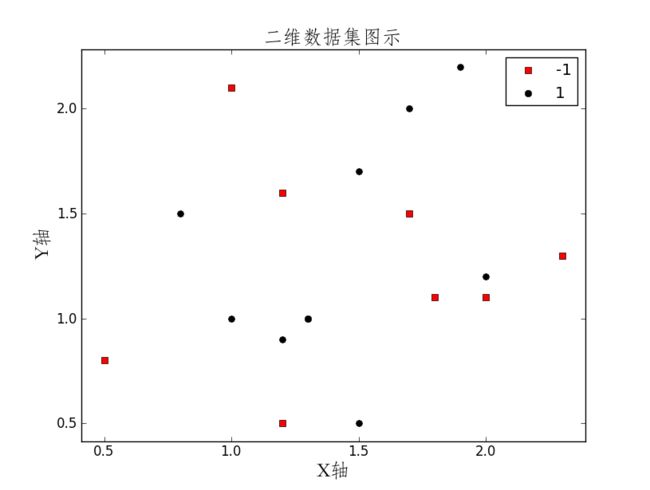
单层决策树函数
def buildStump(datas,labels,W):
    #单层决策树
    #datas是样本数据,labels是标签数据,W是各个样本的权重列表
    N,dim = np.shape(datas)
    divisions = {'dim':np.nan,'pos':np.nan,'cr':1}

    dimshuffle = np.arange(dim)
    np.random.shuffle(dimshuffle)

    for d in dimshuffle:
        ddata = datas[:,d]
        a = list(set(ddata))
        a.sort()

        for i in range(len(a)-1):
            pos = (a[i]+a[i+1])/2 #待考察的分界点
            crit = np.sum(W[(ddata < pos) & (labels == 1)])+np.sum(W[(ddata > pos) & (labels == -1)])
            if crit > 0.5:
                crit = 1- crit
            if  divisions['cr'] > crit:
                divisions['dim'] = d
                divisions['pos'] = pos
                divisions['cr'] = crit
            #print divisions
    locdim = divisions['dim']
    posdata = divisions['pos']
    ddata = datas[:,locdim]
    crit = np.sum(W[(ddata < posdata) & (labels == 1)])+np.sum(W[(ddata > posdata) & (labels == -1)])
    if crit  > 0.5:
        posiside = 'left'
        #predict = ddata < posdata #预测类别
    else:
        posiside = 'right'
        #predict = ddata > posdata

    stump = {'dim':locdim,'pos':posdata,'posiside':posiside}
    return stump
基于单层决策树的Adaboost训练过程
def adaBoostTrain(datas,labels,maxIters = 20):
    N = np.shape(datas)[0] #样本个数
    W = np.array([1.0/N]*N) #权重初始化
    baseclassifier = {}

    F = np.zeros(N)

    for it in range(maxIters):

        stump = buildStump(datas,labels,W)
        #print stump

        dim = stump['dim'] #所在维度
        posdata = stump['pos'] #分界点取值
        posiside = stump['posiside'] #判为正所在的一侧

        ddata = datas[:,dim] #第dim维的数据
        if posiside == 'left':
            predict = ddata < posdata #小于posdata判为正
        else:
            predict = ddata > posdata
        predictlabel = np.array([-1]*N)
        predictlabel[predict] = 1

        errloc = np.where(predictlabel!=labels)[0] #误判的样本序号
        #print errloc
        errsum =np.sum(W[errloc])  #误判的样本的权重之和

        print '分类误差率',str(errsum)

        alpha = 1.0/2*np.log(1.0/errsum-1) #该基本分类器的系数
        stump['coef'] = alpha
        baseclassifier[it] = stump

        yG = np.ones(N)
        yG[errloc] = -1  #误判的样本处为 -1,正确的为1.
        yG *= alpha
        W *= np.exp(-1.0*yG)
        W /= np.sum(W) #对新的样本权重分布概率化


        F += alpha*predictlabel
        print '误判个数:',str(np.sum(np.sign(F) != labels))
        if np.sum(np.sign(F) != labels) == 0:
            break

    return baseclassifier
基于多个弱分类器对输入样本进行分类
def toClassify(baseclassifier,data):
    #整合弱分类器,对样本data进行分类
    F = 0
    for index in baseclassifier:
        stump = baseclassifier[index]
        alpha = stump['coef']
        dim = stump['dim']
        pos = stump['pos']
        posiside = stump['posiside']

        if posiside == 'right':
            if data[dim] > pos:
                F += alpha*(1)
            else:
                F += alpha*(-1)
        else:
            if data[dim] > pos:
                F += alpha*(-1)
            else:
                F += alpha*(1)
    return np.sign(F)
测试过程:
datas,labels = loadData()
baseclassifier = adaBoostTrain(datas,labels,maxIters=20)
分类误差率 0.411764705882
误判个数: 7
分类误差率 0.35
误判个数: 7
分类误差率 0.368131868132
误判个数: 4
分类误差率 0.366645035691
误判个数: 4
分类误差率 0.358984658349
误判个数: 4
分类误差率 0.392311890277
误判个数: 6
分类误差率 0.375141158315
误判个数: 2
分类误差率 0.404727766611
误判个数: 2
分类误差率 0.372741182566
误判个数: 2
分类误差率 0.398559562738
误判个数: 2
分类误差率 0.41125164783
误判个数: 2
分类误差率 0.380866080205
误判个数: 3
分类误差率 0.398736084753
误判个数: 2
分类误差率 0.40166857191
误判个数: 3
分类误差率 0.377835824324
误判个数: 2
分类误差率 0.400252375103
误判个数: 1
分类误差率 0.410077560236
误判个数: 1
分类误差率 0.413392016619
误判个数: 0
for data in datas:
    print toClassify(baseclassifier,data)
-1.0
-1.0
1.0
1.0
-1.0
-1.0
-1.0
1.0
-1.0
1.0
1.0
-1.0
-1.0
1.0
1.0
-1.0
1.0
相关的作图代码:
        fig = plt.figure(figsize=(2, 2), dpi=80)
        colormarker = zip(['k','r','b'],['o','s','*','+'])
        labelsetlist = list(set(labels))

        legendlist = [False]*len(labelsetlist)


        for i,label in enumerate(labels):
            labelindex = labelsetlist.index(label)
            data = datas[i]
            if legendlist[labelindex] == False:
                plt.plot(data[0],data[1],color = colormarker[labelindex][0],marker = colormarker[labelindex][1],
                         label = str(labelsetlist[labelindex]),linestyle = 'None',markersize = 5+W[i]*30)
                legendlist[labelindex] = True
            else:
                plt.plot([data[0]],[data[1]],color = colormarker[labelindex][0],marker = colormarker[labelindex][1],markersize = 5+W[i]*30)
        plt.legend(numpoints=1)
        #下面几行计算图像坐标区间

        mx = np.max(datas,axis=0)
        mn = np.min(datas,axis=0)
        delta = (mx - mn)*0.05
        if stump['dim'] == 0:
            x = np.linspace(stump['pos'],stump['pos'],100)
            y = np.linspace(mn[1]-delta[1],mx[1]+delta[1],100)
        else:
            y = np.linspace(stump['pos'],stump['pos'],100)
            x = np.linspace(mn[0]-delta[0],mx[0]+delta[0],100)
        plt.plot(x,y,linestyle='--')
        plt.xlabel(u'X轴',{'fontname':'STFangsong','fontsize':18})
        plt.ylabel(u'Y轴',{'fontname':'STFangsong','fontsize':18})
        plt.title(u'第%d个弱分类器'%(it+1),{'fontname':'STFangsong','fontsize':18})
        #plt.title(''.join(['第',str(it+1),'个弱分类器']),{'fontname':'STFangsong','fontsize':10})
        plt.axis([mn[0]-delta[0],mx[0]+delta[0],mn[1]-delta[1],mx[1]+delta[1]])
        savefig(''.join(['adaboost',str(it),'.png']),dpi=700,bbox_inches='tight')
        plt.close()