自制Openerp图表
注意:
1. 本文介绍一种简单的,非通用的改进openerp的思路。并非一定要取代原有方式。
2. 本文会修改web_graph模块,如果在你的项目里使用了这个模块,请避免修改,以防止异常。
3. 本文基于openerp 6.1
通过本文,你可以知道:
1. web_graph的运行机制。
2. 如何动手修改这个模块。
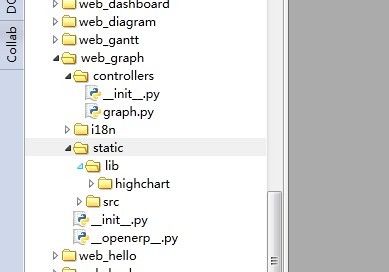
看看这个模块的结构:

客户端采用的是highchart(http://www.highcharts.com/),当然,如果你喜欢其他的lib,都是没问题的。
第一步,把highcharts给包含到模块来,这样openerp才能把这个库合并输出。
把highcharts放置在适合的位置。
下面研究highcharts.
观察highcharts的示例(http://www.highcharts.com/demo/),折线图是这样运行的:
第二步,研究一下服务端。
服务端代码集中在graph.py里。
GraphView类是一个标准的View, 是客户端图表数据的来源,也定义了图表显示方式。如果要修改图表,几乎是要动这个类。
我们来简单的看。首先修改客户端。
只要把服务端返回的数据变成这种格式就可以了。动手:
很简单, 我只处理这样的Graph定义:
第一个field,作为x轴,第二个,作为y轴。第三个,group成多个系列。 这样的处理就是简单化,并不会考虑openerp原来考虑的事情,所以不是一个通用方法。
(另,如果要是想进一步扩展graph,则需要修改addons/base/rng/view.rng的规则。)
下面就是让highcharts显示出来了。
观察web_graph的xml模板和graph.js
我记得原来的xml模板element_id上有一些bug(6.1),我修改了一下:
这是highcharts显示的容器。
重头戏在graph.js里,这里需要处理很多东西,但是也简单。按照原本的客户端views写法:
能看出,主要是三个方法(标准的api,参考openerp客户端的文档):
start, do_search, on_search
start是指本widget启动的时候要做的事情。
do_search, 是启动以后,获取数据。
on_search, 服务端返回数据,根据数据来设置highchart, 显示数据。
需要注意的是,模板里的element_id( t-att-id="element_id+'-chart-'+chart_id" ) 要和 graph.js里的
"container = this.widget_parent.element_id+"-chart-"+this.chart_id; " 一致。
最终,我们得到一个更好看的chart.

继续:
1. 可以写一个更通用的服务端。
2. 可以扩展这个chart,主要对view.rng里规则的修改。
心情不好,写的很笼统,如果有疑问,可以回帖,或者新浪微博 @杨振宇_
谨以此文,纪念我远在天堂的儿子。 愿天父的慈爱永远呵护你。
1. 本文介绍一种简单的,非通用的改进openerp的思路。并非一定要取代原有方式。
2. 本文会修改web_graph模块,如果在你的项目里使用了这个模块,请避免修改,以防止异常。
3. 本文基于openerp 6.1
通过本文,你可以知道:
1. web_graph的运行机制。
2. 如何动手修改这个模块。
看看这个模块的结构:

客户端采用的是highchart(http://www.highcharts.com/),当然,如果你喜欢其他的lib,都是没问题的。
第一步,把highcharts给包含到模块来,这样openerp才能把这个库合并输出。
把highcharts放置在适合的位置。
修改__openerp__.py
{
    "name": "Graph Views",
    "category" : "Hidden",
    "description":"""Graph Views for Web Client

* Parse a <graph> view but allows changing dynamically the presentation
* Graph Types: pie, lines, areas, bars, radar
* Stacked / Not Stacked for areas and bars
* Legends: top, inside (top/left), hidden
* Features: download as PNG or CSV, browse data grid, switch orientation
* Unlimited "Group By" levels (not stacked), two cross level analysis (stacked)
""",
    "version": "3.0",
    "depends": ['web'],
    "js": [
        "static/lib/highchart/js/highcharts.js",
        "static/src/js/graph.js"
    ],
    "css": [
        "static/src/css/*.css",
    ],
    'qweb' : [
        "static/src/xml/*.xml",
    ],
    "auto_install": True
}
下面研究highcharts.
观察highcharts的示例(http://www.highcharts.com/demo/),折线图是这样运行的:
$(function () {
    var chart;
    $(document).ready(function() {
        chart = new Highcharts.Chart({
            chart: {
                renderTo: 'container',
                type: 'line',
                marginRight: 130,
                marginBottom: 25
            },
            title: {
                text: 'Monthly Average Temperature',
                x: -20 //center
            },
            subtitle: {
                text: 'Source: WorldClimate.com',
                x: -20
            },
            xAxis: {
                categories: ['Jan', 'Feb', 'Mar', 'Apr', 'May', 'Jun',
                    'Jul', 'Aug', 'Sep', 'Oct', 'Nov', 'Dec']
            },
            yAxis: {
                title: {
                    text: 'Temperature (°C)'
                },
                plotLines: [{
                    value: 0,
                    width: 1,
                    color: '#808080'
                }]
            },
            tooltip: {
                formatter: function() {
                        return '<b>'+ this.series.name +'</b><br/>'+
                        this.x +': '+ this.y +'°C';
                }
            },
            legend: {
                layout: 'vertical',
                align: 'right',
                verticalAlign: 'top',
                x: -10,
                y: 100,
                borderWidth: 0
            },
            series: [{
                name: 'Tokyo',
                data: [7.0, 6.9, 9.5, 14.5, 18.2, 21.5, 25.2, 26.5, 23.3, 18.3, 13.9, 9.6]
            }, {
                name: 'New York',
                data: [-0.2, 0.8, 5.7, 11.3, 17.0, 22.0, 24.8, 24.1, 20.1, 14.1, 8.6, 2.5]
            }, {
                name: 'Berlin',
                data: [-0.9, 0.6, 3.5, 8.4, 13.5, 17.0, 18.6, 17.9, 14.3, 9.0, 3.9, 1.0]
            }, {
                name: 'London',
                data: [3.9, 4.2, 5.7, 8.5, 11.9, 15.2, 17.0, 16.6, 14.2, 10.3, 6.6, 4.8]
            }]
        });
    });

});
第二步,研究一下服务端。
服务端代码集中在graph.py里。
GraphView类是一个标准的View, 是客户端图表数据的来源,也定义了图表显示方式。如果要修改图表,几乎是要动这个类。
我们来简单的看。首先修改客户端。
只要把服务端返回的数据变成这种格式就可以了。动手:
# -*- coding: utf-8 -*-

import tools
from tools import safe_eval

try:
    # embedded
    import openerp.addons.web.common.http as openerpweb
    from openerp.addons.web.controllers.main import View
except ImportError:
    # standalone
    import web.common.http as openerpweb
    from web.controllers.main import View

from lxml import etree

class GraphView(View):
    _cp_path = '/web_graph/graph'

    @tools.cache(timeout=3600)
    def from_db(self, obj, chart_type, title, fields, domain, group_by, context):
        result = {}
        if len(fields)<2:
            return result

        field_x = fields[1]
        field_y = fields[2]
        field_z = (len(fields)==4) and fields[3] or ''

        ids = obj.search(domain)

        if ids:
            records = obj.read(ids)

            #field_x
            categories = []
            #field_z
            groups = []
            series = []

            if field_z:
                data_set = {}
                for r in records:
                    #get categories.
                    if r[field_x] not in categories:
                        categories.append(r[field_x])

                    if r[field_z] not in groups:
                        groups.append(r[field_z])

                    data_set[r[field_x]+r[field_z]] = r[field_y]

                #transform data
                # series

                for g in groups:
                    s = {'name':g, 'data':[]}
                    for cate in categories:
                        s['data'].append(data_set.get(cate+g, 0))
                    series.append(s)

            else:
                data = []
                for r in records:
                    if r[field_x] not in categories:
                        categories.append(r[field_x])
                    data.append(r[field_y])

                series.append({'data':data})

        return categories, series

    @openerpweb.jsonrequest
    def data_get(self, req, model=None, domain=[], group_by=[], view_id=False, context={}, **kwargs):

        obj = req.session.model(model)
        xml = obj.fields_view_get(view_id, 'graph')
        graph_xml = etree.fromstring(xml['arch'])

        chart_type = graph_xml.attrib.get('type') or 'line'
        chart_title = graph_xml.attrib.get('string') or '图表'
        fields = [ element.attrib.get('name') for element in graph_xml.iter() ]

        data = self.from_db(obj, chart_type, chart_title, fields, domain, group_by, context)

        result = {
            'title':chart_title,
            'categories':data[0],
            'series':data[1],
            'chart_type':chart_type,
        }

        return result
很简单, 我只处理这样的Graph定义:
<record id="view_sale_order_report_monthly_tree" model="ir.ui.view">
        <field eval="1" name="priority"/>
        <field name="name">sale.order.report.monthly.tree</field>
        <field name="model">sale.order.report.monthly</field>
        <field name="type">tree</field>
        <field name="arch" type="xml">
            <tree string="每月销售统计">
                <field name="date" />
                <field name="amount" />
                <field name="source" />
            </tree>
        </field>
    </record>
第一个field,作为x轴,第二个,作为y轴。第三个,group成多个系列。 这样的处理就是简单化,并不会考虑openerp原来考虑的事情,所以不是一个通用方法。
(另,如果要是想进一步扩展graph,则需要修改addons/base/rng/view.rng的规则。)
下面就是让highcharts显示出来了。
观察web_graph的xml模板和graph.js
我记得原来的xml模板element_id上有一些bug(6.1),我修改了一下:
<template>
    <div t-name="GraphView" t-att-id="element_id+'-chart-'+chart_id"
         style="height:300px;position:relative;"/>
</template>
这是highcharts显示的容器。
重头戏在graph.js里,这里需要处理很多东西,但是也简单。按照原本的客户端views写法:
/*---------------------------------------------------------
 * OpenERP web_graph
 *---------------------------------------------------------*/

openerp.web_graph = function (openerp) {

var QWeb = openerp.web.qweb,
     _lt = openerp.web._lt;
openerp.web.views.add('graph', 'openerp.web_graph.GraphView');
openerp.web_graph.GraphView = openerp.web.View.extend({
    display_name: _lt('Graph'),

    init: function(parent, dataset, view_id, options) {
        this._super(parent);
        this.dataset = dataset;
        this.view_id = view_id;
        this.set_default_options(options);
        this.fields_view = {};

        this.model = dataset.model;
        this.chart_id = Math.floor((Math.random()*100)+1);
    },

    start: function() {
        this._super();

        this.$element.html(QWeb.render("GraphView", {
            "chart_id": this.chart_id,
            'element_id': this.widget_parent.element_id
        }));
    },
    stop: function() {
        this._super();
    },

    /*
     * get data here.
    */
    do_search: function(domain, context, group_by) {

        this.rpc(
                   '/web_graph/graph/data_get',
                   {
                       'model': this.model,
                       'domain': domain,
                       'group_by': group_by,
                       'view_id': this.view_id,
                       'context': context
                   }, this.on_search
                );

    },

    on_search: function(result){
        container = this.widget_parent.element_id+"-chart-"+this.chart_id;

        var chart = new Highcharts.Chart({
            chart: {
                renderTo: container,
                height: 300
            },
            title: {
                text: result.title
            },
            xAxis: {
                categories: result.categories
            },
            series: result.series
        });
    },

    do_show: function() {
        this.do_push_state({});
        return this._super();
    }
});
};
// vim:et fdc=0 fdl=0:
能看出,主要是三个方法(标准的api,参考openerp客户端的文档):
start, do_search, on_search
start是指本widget启动的时候要做的事情。
do_search, 是启动以后,获取数据。
on_search, 服务端返回数据,根据数据来设置highchart, 显示数据。
需要注意的是,模板里的element_id( t-att-id="element_id+'-chart-'+chart_id" ) 要和 graph.js里的
"container = this.widget_parent.element_id+"-chart-"+this.chart_id; " 一致。
最终,我们得到一个更好看的chart.

继续:
1. 可以写一个更通用的服务端。
2. 可以扩展这个chart,主要对view.rng里规则的修改。
心情不好,写的很笼统,如果有疑问,可以回帖,或者新浪微博 @杨振宇_
谨以此文,纪念我远在天堂的儿子。 愿天父的慈爱永远呵护你。