【D3.js系列教程】--(十五)SVG基本图形绘制
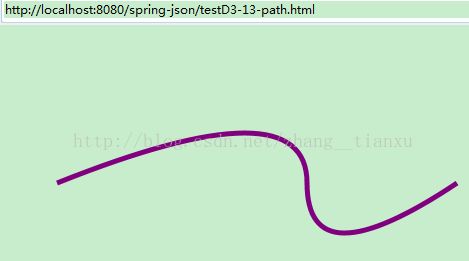
1、路径
<!DOCTYPE html>
<html>
  <head>
		<meta charset="utf-8">
		<title>testD3-13-path.html</title>
		<script type="text/javascript" src="http://localhost:8080/spring/js/d3.v3.js"></script>
	<style type="text/css">
	</style>
	</head>
	<body>
		<script type="text/javascript">
	// 在 body 中插入一個 svg
	var svg = d3.select('body').append('svg');

	// 在 svg 中插入一個 path
	svg.append('path').attr({
		d: 'M50 150Q300 50 300 150T450 150'
	}).style({
		fill: 'none',
		stroke: 'purple',
		'stroke-width': 5
	});
		</script>

	</body>
</html>
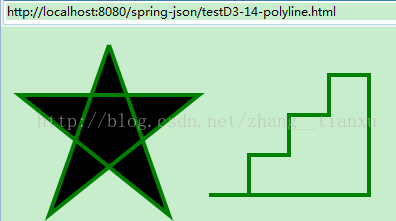
2、折线
<!DOCTYPE html>
<html>
  <head>
		<meta charset="utf-8">
		<title>testD3-14-polyline.html</title>
		<script type="text/javascript" src="http://localhost:8080/spring/js/d3.v3.js"></script>
	<style type="text/css">
	</style>
	</head>
	<body>
		<script type="text/javascript">
// 在 body 中插入一個 svg
	var svg = d3.select('body').append('svg');


	// 在 svg 中插入 polyline
	svg.append('polyline').attr({
		points: '100,10 40,180 190,60 10,60 160,180 100,10'
	}).style({
		fill: 'black',
		stroke: 'green',
		'stroke-width': 4
	});

	// 在 svg 中插入 polyline
	svg.append('polyline').attr({
		points: '200,160 240,160 240,120 280,120 280,80 320,80 320,40 360,40 360,160 240,160'
	}).style({
		fill: 'none',
		stroke: 'green',
		'stroke-width': 4
	});
		</script>

	</body>
</html>
3、多边形
// 在 body 中插入一個 svg
	var svg = d3.select('body').append('svg');
	// 在 svg 中插入 polygon
	svg.append('polygon').attr({
		points: '50,10 20,50 80,50'
	}).style({
		fill: 'none',
		stroke: '#f0f',
		'stroke-width': 4
	});

	// 在 svg 中插入 polygon
	svg.append('polygon').attr({
		points: '70,10 130,10 100,50 '
	}).style({
		fill: 'none',
		stroke: '#520',
		'stroke-width': 4
	});

	// 在 svg 中插入 polygon
	svg.append('polygon').attr({
		points: '150,10 120,50 180,50'
	}).style({
		fill: 'none',
		stroke: '#f0f',
		'stroke-width': 4
	});
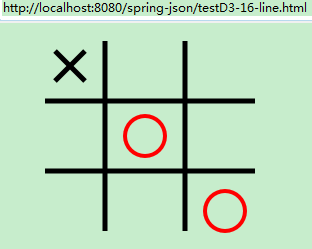
4、直线
<!DOCTYPE html>
<html>
  <head>
		<meta charset="utf-8">
		<title>testD3-16-line.html</title>
		<script type="text/javascript" src="http://localhost:8080/spring/js/d3.v3.js"></script>
	<style type="text/css">
	</style>
	</head>
	<body>
		<script type="text/javascript">
// 在 body 中插入一個 svg
	var svg = d3.select('body').append('svg');

	// 在 svg 中插入 line
	svg.append('line').attr({
		x1: 40,
		y1: 70,
		x2: 250,
		y2: 70
	}).style({
		stroke: 'black',
		'stroke-width': 5
	});

	// 在 svg 中插入 line
	svg.append('line').attr({
		x1: 40,
		y1: 140,
		x2: 250,
		y2: 140
	}).style({
		stroke: 'black',
		'stroke-width': 5
	});

	// 在 svg 中插入 line
	svg.append('line').attr({
		x1: 100,
		y1: 10,
		x2: 100,
		y2: 200
	}).style({
		stroke: 'black',
		'stroke-width': 5
	});

	// 在 svg 中插入 line
	svg.append('line').attr({
		x1: 180,
		y1: 10,
		x2: 180,
		y2: 200
	}).style({
		stroke: 'black',
		'stroke-width': 5
	});

	// 在 svg 中插入 circle
	svg.append('circle').attr({
		cx: 140,
		cy: 105,
		r: 20
	}).style({
		fill: 'none',
		stroke: 'red',
		'stroke-width': 4
	});

	// 在 svg 中插入 line
	svg.append('line').attr({
		x1: 50,
		y1: 20,
		x2: 80,
		y2: 50
	}).style({
		stroke: 'black',
		'stroke-width': 5
	});

	// 在 svg 中插入 line
	svg.append('line').attr({
		x1: 80,
		y1: 20,
		x2: 50,
		y2: 50
	}).style({
		stroke: 'black',
		'stroke-width': 5
	});

	// 在 svg 中插入 circle
	svg.append('circle').attr({
		cx: 220,
		cy: 180,
		r: 20
	}).style({
		fill: 'none',
		stroke: 'red',
		'stroke-width': 4
	});
		</script>

	</body>
</html>

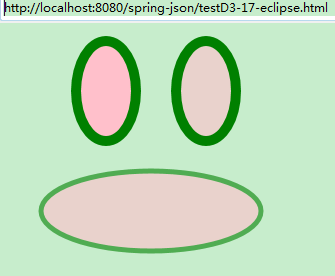
5、椭圆
<!DOCTYPE html>
<html>
  <head>
		<meta charset="utf-8">
		<title>testD3-17-eclipse.html</title>
		<script type="text/javascript" src="http://localhost:8080/spring/js/d3.v3.js"></script>
	<style type="text/css">
	</style>
	</head>
	<body>
		<script type="text/javascript">
// 在 body 中插入一個 svg
	var svg = d3.select('body').append('svg');

		// 在 svg 中插入 ellipse
	svg.append('ellipse').attr({
		cx: 100,
		cy: 60,
		rx: 30,
		ry: 50
	}).style({
		fill: 'pink',
		stroke: 'green',
		'stroke-width': 10
	});

	// 在 svg 中插入 ellipse
	svg.append('ellipse').attr({
		cx: 200,
		cy: 60,
		rx: 30,
		ry: 50
	}).style({
		fill: 'pink',
		stroke: 'green',
		'stroke-width': 10,
		'fill-opacity': .6
	});

	// 在 svg 中插入 ellipse
	svg.append('ellipse').attr({
		cx: 145,
		cy: 180,
		rx: 110,
		ry: 40
	}).style({
		fill: 'pink',
		stroke: 'green',
		'stroke-width': 5,
		opacity: .6
	});
		</script>

	</body>
</html>


