PySpark处理数据并图表分析
http://www.aboutyun.com/thread-18150-1-1.html
PySpark简介
- 官方对PySpark的释义为:“PySpark is the Python API for Spark”。 也就是说pyspark为Spark提供的Python编程接口。
- Spark使用py4j来实现python与java的互操作,从而实现使用python编写Spark程序。Spark也同样提供了pyspark,一个Spark的python shell,可以以交互式的方式使用Python编写Spark程序。 如:
[Python]
纯文本查看
复制代码
|
1
2
3
4
|
from
pyspark
import
SparkContext
sc
=
SparkContext(
"local"
,
"Job Name"
, pyFiles
=
[
'MyFile.py'
,
'lib.zip'
,
'app.egg'
])
words
=
sc.textFile(
"/usr/share/dict/words"
)
words.
filter
(
lambda
w:w.startswith(
"spar"
)).take(
5
)
|
PySpark文档主页界面:

PySpark是构建在Java API之上的,如下图:

处理数据并图表分析
下面我通过PySpark对真实的数据集进行处理,并作图形来分析。首先我需要介绍下数据集以及数据处理的环境。
数据集
MovieLens数据集是由Minnesota大学的GroupLens Research Project对电影评分网站(movielens.umn.edu)收集的,数据集包含了1997年9月19日到1998年四月22日间共七个月的数据。这些数据已经被处理过了(清除了那些评分次数少于20次以及信息没有填写完整的数据)
MovieLens数据集:
MovieLens数据集,用户对自己看过的电影进行评分,分值为1~5。MovieLens包括两个不同大小的库,适用于不同规模的算法.小规模的库是943个独立用户对1682部电影作的10000次评分的数据(我是用这个小规模作数据处理和分析);通过对数据集分析,为用户预测他对其他未观看的电影的打分,将预测分值高的电影推荐给用户,认为这些电影是用户下一步感兴趣的电影。
数据集结构:
1、943个用户对1682场电影评分,评判次数为100000次,评分标准:1~5分。
2、每位用户至少评判20场电影。
3、简单地统计了用户的一些信息 (age, gender, occupation, zip)
数据用途:
供科研单位和研发企业使用,可用于数据挖掘、推荐系统,人工智能等领域,复杂网络研究等领域。
数据处理的环境
- Hadoop伪分布环境
- Spark Standalone环境
- Anaconda环境:(下载地址:https://www.continuum.io/downloads)
- Anaconda Python 是 Python 科学技术包的合集,包含超过400个流行的科学计算、数学、工程以及数据分析用的包。这里我主要是用它的一些包,免得自己装一些Python包麻烦。
其他:
处理一(用户年龄统计分析)
处理一简介:
通过对用户数据处理,获得用户信息中的年龄。然后对年龄进行统计并使用Python中的图形框架Matplotlib生成柱状图,最后通过柱状图分析观看电影的观众年龄分布趋势。
处理一所有代码:
[Plain Text]
纯文本查看
复制代码
|
01
02
03
04
05
06
07
08
09
10
11
12
13
14
15
16
17
18
19
20
21
22
23
24
|
#加载HDFS上面的用户数据
user_data = sc.textFile("hdfs:/input/ml-100k/u.user")
#打印加载的用户信息第一条
user_data.first()
#用"|"分割符分割每一行的数据,然后将数据返回到user_fields
user_fields = user_data.map(lambda line: line.split("|"))
#统计总的用户数
num_users = user_fields.map(lambda fields: fields[0]).count()
#统计性别的种类数,distinct()函数用来去重。
num_genders = user_fields.map(lambda fields:fields[2]).distinct().count()
#统计职位种类数
num_occupations = user_fields.map(lambda fields:fields[3]).distinct().count()
#统计邮政编码种类数
num_zipcodes = user_fields.map(lambda fields:fields[4]).distinct().count()
#打印统计的这些信息
print "Users: %d, genders: %d, occupations: %d, ZIP codes: %d" % (num_users, num_genders, num_occupations, num_zipcodes)
#统计用户年龄
ages = user_fields.map(lambda x: int(x[1])).collect()
#通过python中的matplotlib生成图表提供给分析师分析
import matplotlib.pyplot as plt
hist(ages, bins=20, color='lightblue', normed=True)
fig = plt.gcf()
fig.set_size_inches(16, 10)
plt.show()
|
进入Spark安装目录的,然后输入如下命令开启pyspark:
[Shell]
纯文本查看
复制代码
|
1
|
.
/bin/pyspark
|
之后加载HDFS上面的用户数据(u.user),然后通过user_data.first()打印第一条数据显示数据格式。
统计的HDFS上面的所有用户信息:总共943位用户、男女两种性别、21中职位、795个不同的邮政编码。
Matplotlib是一个Python的图形框架,下面为matplotlib工作过程的打印信息:
Matplotlib对统计后的数据图形化显示:
用户年龄分布图:
结论:
通过生成的柱状图我们可以看出这些电影观众年龄段趋于青年,并且大部分用户年龄都在15到35之间。
处理二(用户职位统计分析)
处理二简介:
首先对用户数据处理,获得用户信息中的职位种类以及每种职位用户个数。然后对职位进行统计并使用Python中的图形框架Matplotlib生成柱状图,最后通过柱状图分析观看电影的观众职位以及人数分布趋势。
处理二所有代码:
[Python]
纯文本查看
复制代码
|
01
02
03
04
05
06
07
08
09
10
11
12
13
14
15
16
17
18
19
20
21
22
23
24
25
|
#处理职位那一列,通过类似于MapReduce经典例子WordCount处理过程处理职位
count_by_occupation
=
user_fields.
map
(
lambda
fields: (fields[
3
],
1
)).reduceByKey(
lambda
x, y: x
+
y).collect()
#导入numpy模块
import
numpy as np
#获取用户职位,并作为柱状图的x轴数据显示
x_axis1
=
np.array([c[
0
]
for
c
in
count_by_occupation])
#获取用户的各个职位数,并作为y轴数据显示
y_axis1
=
np.array([c[
1
]
for
c
in
count_by_occupation])
#让x轴类别的显示按照y轴中每种职位的个数升序排序
x_axis
=
x_axis1[np.argsort(y_axis1)]
#y轴也是升序
y_axis
=
y_axis1[np.argsort(y_axis1)]
#设置柱状图中x轴范围以及width
pos
=
np.arange(
len
(x_axis))
width
=
1.0
#将统计的职位信息使用matplotlib生成柱状图
from
matplotlib
import
pyplot as plt
ax
=
plt.axes()
ax.set_xticks(pos
+
(width
/
2
))
ax.set_xticklabels(x_axis)
plt.bar(pos, y_axis, width, color
=
'lightblue'
)
plt.xticks(rotation
=
30
)
fig
=
plt.gcf()
fig.set_size_inches(
16
,
10
)
plt.show()
|
用户职位信息处理过程:
用户职位信息统计并生成柱状图:
用户职位分布图:
结论:
从最终生成的图表中,我们可以看出电影观众大部分都是student, educator, administrator, engineer和programmer。并且student的人数领先其他职位一大截。
处理三(电影发布信息统计分析)
处理三简介:
- 首先对用户数据处理,获得用户评价的电影发布时间信息。然后以1998年为最高年限减去电影发布的年限(数据集统计的时间为1998年)得到的值作为x轴,接着通过Python中的图形框架Matplotlib生成柱状图,最后通过柱状图分析当时电影发布时间趋势。
- 电影信息有一些脏数据,所以需要先作处理。
处理三所有代码:
[Python]
纯文本查看
复制代码
|
01
02
03
04
05
06
07
08
09
10
11
12
13
14
15
16
17
18
19
20
21
22
23
24
25
26
27
28
29
|
#从HDFS中加载u.item数据
movie_data
=
sc.textFile(
"hdfs:/input/ml-100k/u.item"
)
#打印第一条数据,查看数据格式
print
movie_data.first()
#统计电影总数
num_movies
=
movie_data.count()
print
"Movies: %d"
%
num_movies
#定义函数功能为对电影数据预处理,对于错误的年限,使用1900填补
def
convert_year(x):
try
:
return
int
(x[
-
4
:])
except
:
return
1900
# there is a 'bad' data point with a blank year,which we set to 900 and will filter out later
#使用"|"分隔符分割每行数据
movie_fields
=
movie_data.
map
(
lambda
lines: lines.split(
"|"
))
#提取分割后电影发布年限信息,并做脏数据预处理
years
=
movie_fields.
map
(
lambda
fields: fields[
2
]).
map
(
lambda
x:convert_year(x))
#获取那些年限为1900的电影(部分为脏数据)
years_filtered
=
years.
filter
(
lambda
x: x !
=
1900
)
#计算出电影发布时间与1998年的年限差
movie_ages
=
years_filtered.
map
(
lambda
yr:
1998
-
yr).countByValue()
#将年限差作为x轴,电影数量作为y轴作柱状图
values
=
movie_ages.values()
bins
=
movie_ages.keys()
from
matplotlib
import
pyplot as plt1
plt1.hist(values, bins
=
bins, color
=
'lightblue'
, normed
=
True
)
fig
=
plt1.gcf()
fig.set_size_inches(
16
,
10
)
plt1.show()
|
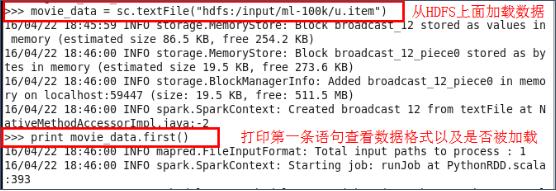
从HDFS上加载电影数据并打印第一条数据查看数据格式:
打印的电影数据格式:
打印的电影总数:
电影发布年限统计并生成柱状图:
电影发布年限分布图:(x轴为1998减去电影发布年限)
结论:
从最终生成的图表中,我们可以看出绝大多数电影发布时间都在1988-1998年之间。
处理四(用户评分统计分析)
处理四简介:
首先对用户数据处理,获得用户对电影的评分数,然后统计评分1-5的每个评分个数,然后绘制图表供分析。
处理四所有代码:
[Python]
纯文本查看
复制代码
|
01
02
03
04
05
06
07
08
09
10
11
12
13
14
15
16
17
18
19
20
21
22
23
24
25
26
27
28
29
30
31
32
33
34
35
36
37
38
39
40
41
42
43
44
45
46
47
48
49
|
#从HDFS上面加载用户评分数据
rating_data
=
sc.textFile(
"hdfs:/input/ml-100k/u.data"
)
print
rating_data.first()
#统计评分记录总数
num_ratings
=
rating_data.count()
print
"Ratings: %d"
%
num_ratings
#使用"\t"符分割每行数据
rating_data
=
rating_data.
map
(
lambda
line: line.split(
"\t"
))
#获取每条数据中的用户评分数集合
ratings
=
rating_data.
map
(
lambda
fields:
int
(fields[
2
]))
#获取最大评分数
max_rating
=
ratings.
reduce
(
lambda
x, y:
max
(x, y))
#获取最小评分数
min_rating
=
ratings.
reduce
(
lambda
x, y:
min
(x, y))
#获取平均评分数
mean_rating
=
ratings.
reduce
(
lambda
x, y: x
+
y)
/
num_ratings
#获取评分中位数
median_rating
=
np.median(ratings.collect())
#每位用户平均评分
ratings_per_user
=
num_ratings
/
num_users
#每位用户评了几场电影
ratings_per_movie
=
num_ratings
/
num_movies
#打印上面这些信息
print
"Min rating: %d"
%
min_rating
print
"Max rating: %d"
%
max_rating
print
"Average rating: %2.2f"
%
mean_rating
print
"Median rating: %d"
%
median_rating
print
"Average # of ratings per user: %2.2f"
%
ratings_per_user
print
"Average # of ratings per movie: %2.2f"
%
ratings_per_movie
#获取评分数据
count_by_rating
=
ratings.countByValue()
import
numpy as np
#x轴的显示每个评分(1-5)
x_axis
=
np.array(count_by_rating.keys())
#y轴显示每个评分所占概率,总概率和为1
y_axis
=
np.array([
float
(c)
for
c
in
count_by_rating.values()])
y_axis_normed
=
y_axis
/
y_axis.
sum
()
pos
=
np.arange(
len
(x_axis))
width
=
1.0
#使用matplotlib生成柱状图
from
matplotlib
import
pyplot as plt2
ax
=
plt2.axes()
ax.set_xticks(pos
+
(width
/
2
))
ax.set_xticklabels(x_axis)
plt2.bar(pos, y_axis_normed, width, color
=
'lightblue'
)
plt2.xticks(rotation
=
30
)
fig
=
plt2.gcf()
fig.set_size_inches(
16
,
10
)
plt2.show()
|
从HDFS加载数据
评分记录总数:
评分的一些统计信息;
统计评分信息并生成柱状图:
用户电影评价分布图:
结论:
从图中我们可以看出电影的评分大都在3-5分之间。
处理五简介:
首先对用户数据处理,获得用户对电影的总评分数(每位至少评价20次,评分在1-5之间)然后绘制图表供分析。
处理四所有代码:
[Python]
纯文本查看
复制代码
|
01
02
03
04
05
06
07
08
09
10
11
12
13
|
#获取用户评分次数和每次评分
user_ratings_grouped
=
rating_data.
map
(
lambda
fields: (
int
(fields[
0
]),
int
(fields[
2
]))).groupByKey()
#用户ID以及该用户评分总数
user_ratings_byuser
=
user_ratings_grouped.
map
(
lambda
(k, v): (k,
len
(v)))
#打印5条结果
user_ratings_byuser.take(
5
)
#生成柱状图
from
matplotlib
import
pyplot as plt3
user_ratings_byuser_local
=
user_ratings_byuser.
map
(
lambda
(k, v):v).collect()
plt3.hist(user_ratings_byuser_local, bins
=
200
, color
=
'lightblue'
,normed
=
True
)
fig
=
plt3.gcf()
fig.set_size_inches(
16
,
10
)
plt3.show()
|
打印用户5条处理后的结果:
生成每位用户评分总数分布图:
结论:
从图中可以看出总评分在100以内的占了绝大多数。当然,100到300之间还是有一部分的。
1、要显示Python图标,必须要操作系统有图形界面。
2、Python必要有matplotlib 模块。
3、必须要以root用户开启PySpark,不然会报以下错误,没有权限连接x Server。


