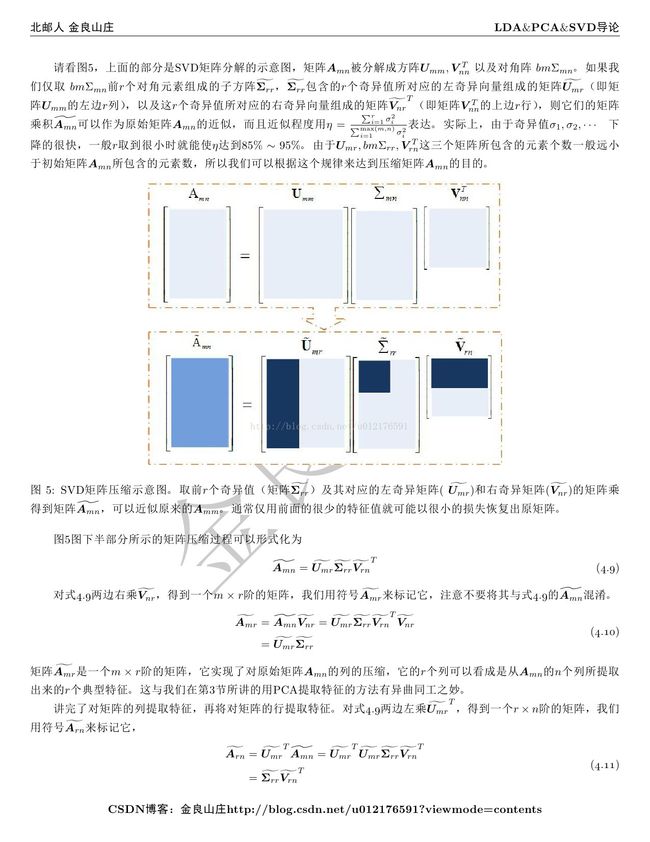
LDA_PCA_SVD导论

作者:金良([email protected]) csdn博客:http://blog.csdn.net/u012176591
资源链接 http://download.csdn.net/detail/u012176591/8257297


相关源码:
svd.py
import numpy
import random
import matplotlib.pyplot as pyplot

data = numpy.array([[1,0.6,1,0,0.4],\
                    [2,1.7,2,0.2,0],\
                    [1,0,1,0.1,0],\
                    [3.2,4.8,5,0,0.4],\
                    [1,1,1.3,2,2],\
                    [0,0,0,3.2,3],\
                    [0,0,0,0.9,1]])
U,Sigma,VT=numpy.linalg.svd(data)
print U.shape,VT.shape,Sigma.shape
print Sigma
i=2
colomnclass=data.dot(VT[:i,:].T)
print colomnclass
rowclass = U[:,:i].T.dot(data)
print rowclass

pyplot.figure(1)
ax1=pyplot.subplot(211)
ax2=pyplot.subplot(212)
pyplot.sca(ax1)
pyplot.plot(colomnclass[:,0],colomnclass[:,1],'s')
pyplot.sca(ax2)
pyplot.plot(rowclass[0,:],rowclass[1,:],'^')
pyplot.show()
PCA_sample.py
# -*- coding: cp936 -*-
import numpy
import scipy
import random
import matplotlib.pyplot as pyplot
import scipy.linalg as linalg
import scipy.stats as stats


def loaddata():
    dataset=[]
    locset =[]
    center = numpy.array([2,2])
    direct = numpy.array([-1,1])
    gauss = stats.norm(0,0.6)
    direct = numpy.divide(numpy.array([-1,1]),linalg.norm(numpy.array([-1,1])))
    for i in range(50):
        bias = random.gauss(0,2)#偏移center的长度
        while numpy.abs(bias)>1.6:#限制偏移的幅度
            bias = random.gauss(0,0.4)
        loc =center +bias*center/linalg.norm(center)#投射到45度角上的坐标点
        locset.append(loc)
        gausspdf = gauss.pdf(bias)
        label =random.random()-0.5
        dataset.append(loc+label*gausspdf*direct)
    return numpy.array(dataset),numpy.array(locset)
def plot(dataset,locset):
    pyplot.plot(dataset[:,0],dataset[:,1],'r^')
    locset[:,0] = locset[:,0]+0.3;locset[:,1]=locset[:,1]-0.3
    pyplot.plot(locset[:,0],locset[:,1],'k+')
    for i in range(dataset.shape[0]):
        pyplot.plot([locset[i,0],dataset[i,0]],[locset[i,1],dataset[i,1]],'y--')
    pyplot.annotate('',xytext=(1.6,1.6),xy=(3.0,3.0),arrowprops=dict(facecolor='black',width =3, shrink=0.01))
    pyplot.annotate('',xytext=(1.65,1.65),xy=(1.45,1.85),arrowprops=dict(facecolor='black',width =1, shrink=0.01))
    pyplot.text(1.5,1.9,'Noise',color="black",ha="center")
    pyplot.text(2.8,3,'Signal',color="black",ha="center")
    pyplot.xlim(0.5,3.5)
    pyplot.ylim(0.5,3.5)
    pyplot.xlabel("x axis")
    pyplot.ylabel("y axis")
    #pyplot.title("PCA example")
    pyplot.show()
dataset,locset =loaddata()
plot(dataset,locset)
本博文的TeX源码:https://code.csdn.net/snippets/610273/master/LDA_PCA_SVD%E5%AF%BC%E8%AE%BA.tex/raw
- Small sample size effects in statistical pattern recognitioin
- Eigenfaces vs. Fisherfaces-Recognition Using Class Specific Linear Projection
- facerec_python