python画图
python下面画图的包是matplotlib(http://matplotlib.org/),想要运行这个包,一般都要安装Numpy和Scipy包。
安装好,具体执行的时候,可能还需安装setuptools包、dateutil包和pyparsing包,这些包如何安装只要google就可以。
下面是一个画图的具体例子。
from pylab import *

import matplotlib.pyplot as plt
# import matplotlib.font_manager as fm

pv = [11123, 11360, 11616, 11677, 10055,
      10266, 11285, 11067, 10594, 10301,
      9699, 9073, 9519, 9301, 8840,
      8200, 6851, 7784, 7281, 7770,
      8139, 8289, 8388, 9321, 10661,
      11248, 10619, 11545, 11246, 11398, 11729]
uv = [403, 400, 406, 405, 367,
      364, 398, 397, 387, 383,
      374, 345, 354, 350, 338,
      317, 279, 279, 267, 277,
      287, 297, 308, 330, 370,
      376, 360, 398, 399, 404,
      415]

fs = 16

plt.figure(1)
l1 = plt.subplot(211)
plt.plot(pv, '-og', linewidth = 2, label = 'PV')
plt.xlabel('View days', fontsize = fs)
plt.ylabel('# Page Views', fontsize = fs)
plt.title('PV', fontsize = fs)
plt.grid(True)

legend(loc = 5)

# xlabel fontsize
for label in l1.xaxis.get_ticklabels():
    label.set_fontsize(fs)
for label in l1.yaxis.get_ticklabels():
    label.set_fontsize(fs)


l2 = plt.subplot(212)
plt.plot(uv, '-or', linewidth = 2, label = 'UV')
plt.xlabel('View days', fontsize = fs)
plt.ylabel('# Unique Visitors', fontsize = fs)
plt.title('UV', fontsize = fs)
plt.grid(True)

legend(loc = 5)

for label in l2.xaxis.get_ticklabels():
    label.set_fontsize(fs)
for label in l2.yaxis.get_ticklabels():
    label.set_fontsize(fs)


plt.show()
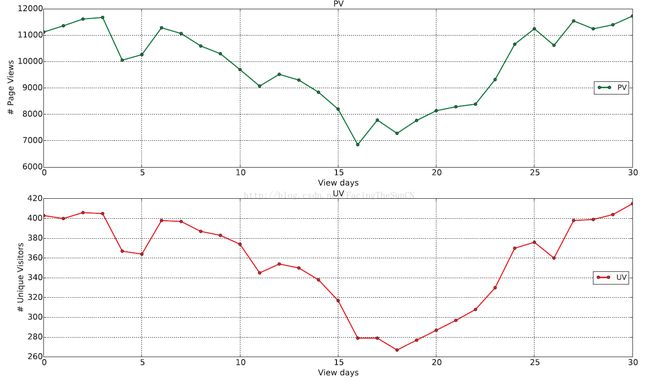
画图的结果是:
另一个例子:
import matplotlib.pyplot as plt

k1 = 5
L1 = 100
p = arange(0, 1, 0.01)
y1 = 1 - ((1 - p**k1)**L1)
plt.plot(p, y1, 'b', label = 'k=5,L=100')

plt.hold(True)

k2 = 10
L2 = 1000
y2 = 1 - ((1 - p**k2)**L2)
plt.plot(p,y2, 'r', label = 'k=10,L=1000')

plt.xlim(-0.1, 1.1)
plt.ylim(-0.1, 1.1)
plt.grid(True)

plt.xlabel('Similarity')
plt.ylabel('Collision probability')

legend(loc=5)

plt.show()
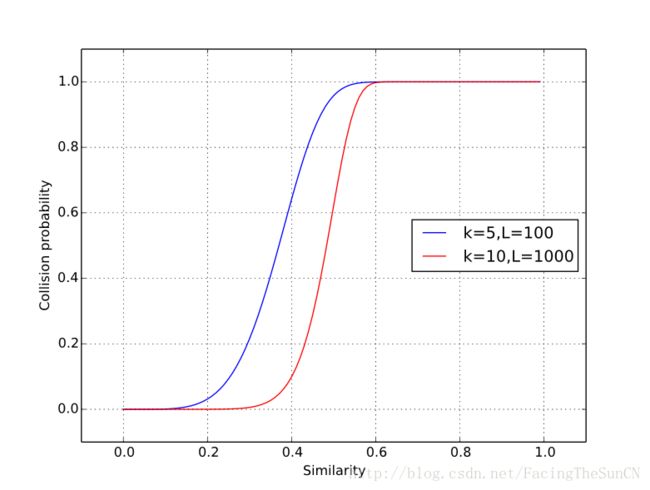
画图结果是:

