spark机器学习笔记:(四)用Spark Python构建分类模型(上)
声明:版权所有,转载请联系作者并注明出处 http://blog.csdn.net/u013719780?viewmode=contents
博主简介:风雪夜归子(英文名:Allen),机器学习算法攻城狮,喜爱钻研Meachine Learning的黑科技,对Deep Learning和Artificial Intelligence充满兴趣,经常关注Kaggle数据挖掘竞赛平台,对数据、Machine Learning和Artificial Intelligence有兴趣的童鞋可以一起探讨哦,个人CSDN博客:http://blog.csdn.net/u013719780?viewmode=contents
本文,我将简单介绍分类模型的基础知识以及如何在各种应用中使用这些模型。分类通常是指将事物分成不同的类别。在分类模型中,我们期望根据一组特征来判断类别,这些特征代表了物体、事件或上下文相关的属性(变量)。
最简单的分类形式是分两个类别,即“二分类”。一般讲其中一类标记为正类(记为1),另外一类标记为负类(记为-1或者0)。
分类是监督学习的一种形式,我们用带有类标记或者类输出的训练样本训练模型(也就是通过输出结果监督被训练的模型)。分类模型适用于很多情形,一些常见的例子如下:
-
预测互联网用户对在线广告的点击概率,这本质上是一个二分类问题(点击或者不点击);
-
检测欺诈,这同样是一个二分类问题(欺诈或者不是欺诈);
-
预测拖欠贷款(二分类问题);
-
对图片、视频或者声音分类(大多情况下是多分类,并且有许多不同的类别);
-
对新闻、网页或者其他内容标记类别或者打标签(多分类);
-
发现垃圾邮件、垃圾页面、网络入侵和其他恶意行为(二分类或者多分类);
-
检测故障,比如计算机系统或者网络的故障检测;
-
根据顾客或者用户购买产品或者使用服务的概率对他们进行排序(这可以建立分类模型预测概率并根据概率从大到小排序);
-
预测顾客或者用户中谁有可能停止使用某个产品或服务。
上面仅仅列举了一些可行的用例。实际上,在现代公司特别是在线公司中,分类方法可以说是机器学习和统计领域使用最广泛的技术之一。
本文主要介绍如下内容:
讨论MLlib中各种可用的分类模型;
使用Spark从原始输入数据中抽取合适的特征;
使用MLlib训练若干分类模型;
用训练好的分类模型做预测;
应用一些标准的评价方法来评估模型的预测性能;
使用博文 spark机器学习系列:(二)用Spark Python进行数据处理和特征提取 中的特征抽取方法来说明如何改进模型性能;
研究参数调优对模型性能的影响,并且学习如何使用交叉验证来选择最优的模型参数。
1 分类模型的种类
目前,Spark的MLlib库提供了基于线性模型、决策树和朴素贝叶斯的二分类模型,以及基于决策树和朴素贝叶斯的多类别分类模型。本博文仅关注二分类问题。
1.1 线性模型
线性模型的核心思想是对样本的预测结果(通常称为目标或者因变量)进行建模,即对输入变量(特征或者自变量)应用简单的线性预测函数。
这里,y是目标变量,W是参数向量,X是特征向量,f 称为连接函数。
实际上,通过简单改变连接函数f, 线性模型不仅可以用于分类还可以用于回归。标准的线性回归(见下期博文)使用对等连接函数(identity link,即直接使用y =wTx),而线性分类器使用上面提到的连接函数。
我们要训练一个模型,将给定输入的特征向量(广告曝光)映射到预测的输出(点击或者未点击)。对于一个新的数据点,我们将得到一个新的特征向量(此时不知道预测的目标输出),并将其与权重向量进行点积。然后对点积的结果应用连接函数,最后函数的结果便是预测的输出(在一些模型中,还会将输出结果与设定的阈值进行判断后得到预测结果)。
给定输入数据的特征向量和相关的目标值,存在一个权重向量能够最好对数据进行拟合,拟合的过程即最小化模型输出与实际值的误差。这个过程称为模型的拟合、训练或者优化。
具体来说,我们需要找到一个权重向量能够最小化所有训练样本的由损失函数计算出来的损失(误差)之和。损失函数的输入是给定的训练样本的权重向量、特征向量和实际输出,输出是损失。实际上,损失函数也被定义为连接函数,每个分类或者回归函数会有对应的损失函数。
本文不会讨论线性模型和损失函数的细节,只介绍MLlib提供的两个适合二分类模型的损失函数(更多内容请看Spark文档)。第一个是逻辑损失(logistic loss),等价于逻辑回归模型。第二个是合页损失(hinge loss),等价于线性支持向量机(Support Vector Machine,SVM)。需要指出的是,这里的SVM严格上不属于广义线性模型的统计框架,但是当制定损失函数和连接函数时在使用方法上相同。
下图展示了与0-1损失相关的逻辑损失和合页损失。对二分类来说,0-1损失的值在模型预测正确时为0,在模型预测错误时为1实际中,0-1损失并不常用,原因是这个损失函数不可微,计算梯度非常困难并且难以优化。而其他的损失函数作为0-1损失的近似可以进行优化。
1.1.1逻辑回归
逻辑回归的损失函数如下:
其中y是实际的输出值(正类为1,负类为-1)。
1.1.2线性支持向量机
SVM在回归和分类方面是一个强大且流行的技术。和逻辑回归不同,SVM并不是概率模型,但是可以基于模型对正负的估计预测类别。SVM的连接函数是一个对等连接函数,因此预测的输出表示为:
因此,当 wTx的估计值大于等于阈值0时,SVM对数据点标记为1,否则标记为0(其中阈值是SVM可以自适应的模型参数)。
SVM的损失函数被称为合页损失,定义为:
SVM是一个最大间隔分类器,它试图训练一个使得类别尽可能分开的权重向量。在很多分类任务中,SVM不仅表现得性能突出,而且对大数据集的扩展是线性变化的。
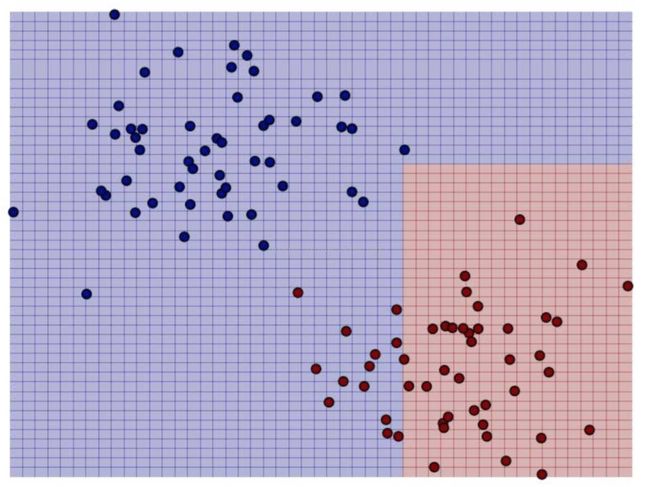
在下图中,基于原先的二分类简单样例,我们画出了关于逻辑回归(蓝线)和线性SVM(红线)的决策函数:
从图中可以看出SVM可以有效定位到最靠近决策函数的数据点(间隔线用红色的虚线表示)。
1.2 朴素贝叶斯模型
朴素贝叶斯是一个概率模型,通过计算给定数据点在某个类别的概率来进行预测。朴素贝叶斯模型假设每个特征分配到某个类别的概率是独立分布的(假定各个特征之间条件独立),这也是朴素贝叶斯叫法的原因。
基于这个假设,属于某个类别的概率表示为若干概率乘积的函数,其中这些概率包括某个特征在给定某个类别的条件下出现的概率(条件概率),以及该类别的概率(先验概率)。这样使得模型训练非常直接且易于处理。类别的先验概率和特征的条件概率可以通过数据的频率估计得到。分类过程就是在给定特征和类别概率的情况下选择最可能的类别。
1.3 决策树
决策树是一个强大的非概率模型,它可以表达复杂的非线性模式和特征相互关系。决策树在很多任务上表现出的性能很好,相对容易理解和解释,可以处理类属或者数值特征,同时不要求输入数据归一化或者标准化。决策树非常适合应用集成方法(ensemble method),比如多个决策树的集成,称为决策树森林。
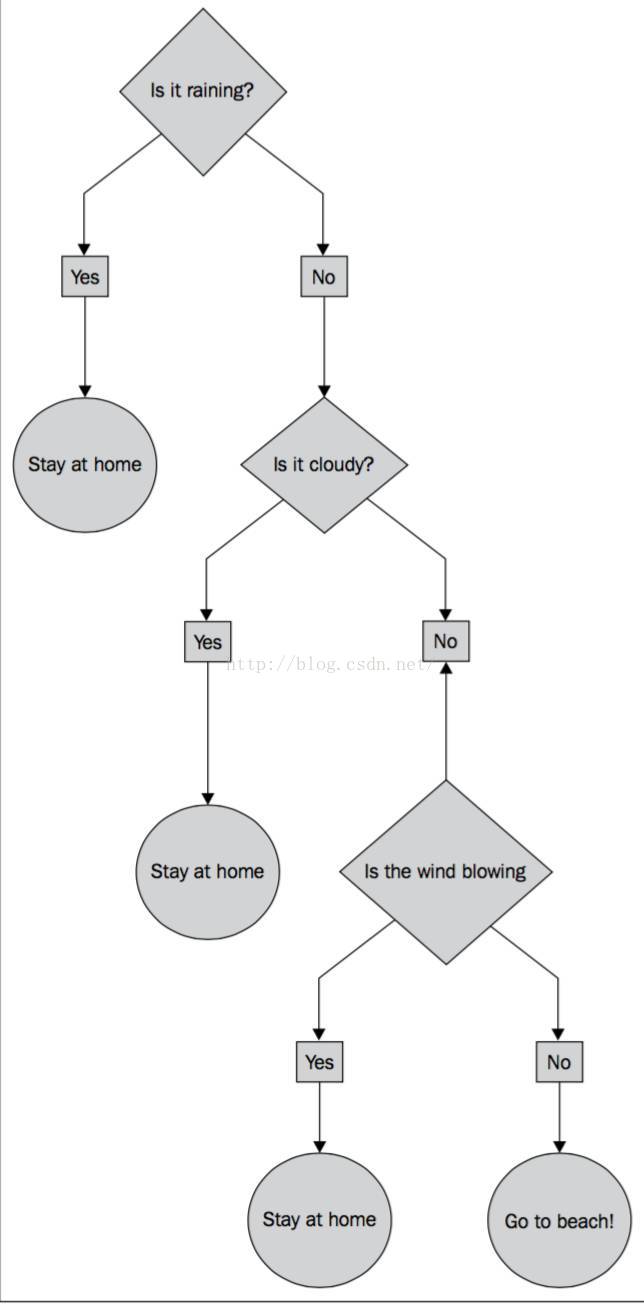
决策树模型就好比一棵树,叶子代表值为0或1的分类,树枝代表特征。如图5-6所示,二元输出分别是“待在家里”和“去海滩”,特征则是天气。

决策树算法是一种自上而下始于根节点(或特征)的方法,在每一个步骤中通过评估特征分裂的信息增益,最后选出分割数据集最优的特征。信息增益通过计算节点不纯度(即节点标签不相似或不同质的程度)减去分割后的两个子节点不纯度的加权和。对于分类任务,这里有两个评估方法用于选择最好的分割:基尼系数和熵。
2 从数据中抽取合适的特征
回顾博文 spark机器学习系列:(二)用Spark Python进行数据处理和特征提取 ,可以发现大部分机器学习模型以特征向量的形式处理数值数据。另外,对于分类和回归等监督学习方法,需要将目标变量(或者多类别情况下的变量)和特征向量放在一起。
MLlib中的分类模型通过LabeledPoint对象操作,其中封装了目标变量(标签)和特征向量:
LabeledPoint(label: Double, features: Vector)
虽然在使用分类模型的很多样例中会碰到向量格式的数据集,但在实际工作中,通常还需要从原始数据中抽取特征 ,包括封装数值特征、归一或者正则化特征,以及使用1-of-k编码表示类属特征 ,具体方法可以参考博文 机器学习系列:(三)特征提取与处理。
从Kaggle/StumbleUpon evergreen分类数据集中抽取特征
考虑到上一篇博文推荐模型中的MovieLens数据集和分类问题无关,本章将使用另外一个数据集。这个数据集源自Kaggle比赛,由StumbleUpon提供。比赛的问题涉及网页中推荐的页面是短暂(短暂存在,很快就不流行了)还是长久(长时间流行)。 数据的链接 : http://www.kaggle.com/c/stumbleupon/data。
为了让Spark更好地操作数据,我们需要删除文件第一行的列头名称。先进入到数据文件所在目录,然后执行命令:
sed 1d train.tsv > train_noheader.tsv
rawData = sc.textFile('/Users/youwei.tan/Downloads/train_noheader.tsv')
records = rawData.map(lambda x: x.split('\t'))
print records.first()
[u'"http://www.bloomberg.com/news/2010-12-23/ibm-predicts-holographic-calls-air-breathing-batteries-by-2015.html"', u'"4042"', u'"{""title"":""IBM Sees Holographic Calls Air Breathing Batteries ibm sees holographic calls, air-breathing batteries"",""body"":""A sign stands outside the International Business Machines Corp IBM Almaden Research Center campus in San Jose California Photographer Tony Avelar Bloomberg Buildings stand at the International Business Machines Corp IBM Almaden Research Center campus in the Santa Teresa Hills of San Jose California Photographer Tony Avelar Bloomberg By 2015 your mobile phone will project a 3 D image of anyone who calls and your laptop will be powered by kinetic energy At least that s what International Business Machines Corp sees in its crystal ball The predictions are part of an annual tradition for the Armonk New York based company which surveys its 3 000 researchers to find five ideas expected to take root in the next five years IBM the world s largest provider of computer services looks to Silicon Valley for input gleaning many ideas from its Almaden research center in San Jose California Holographic conversations projected from mobile phones lead this year s list The predictions also include air breathing batteries computer programs that can tell when and where traffic jams will take place environmental information generated by sensors in cars and phones and cities powered by the heat thrown off by computer servers These are all stretch goals and that s good said Paul Saffo managing director of foresight at the investment advisory firm Discern in San Francisco In an era when pessimism is the new black a little dose of technological optimism is not a bad thing For IBM it s not just idle speculation The company is one of the few big corporations investing in long range research projects and it counts on innovation to fuel growth Saffo said Not all of its predictions pan out though IBM was overly optimistic about the spread of speech technology for instance When the ideas do lead to products they can have broad implications for society as well as IBM s bottom line he said Research Spending They have continued to do research when all the other grand research organizations are gone said Saffo who is also a consulting associate professor at Stanford University IBM invested 5 8 billion in research and development last year 6 1 percent of revenue While that s down from about 10 percent in the early 1990s the company spends a bigger share on research than its computing rivals Hewlett Packard Co the top maker of personal computers spent 2 4 percent last year At Almaden scientists work on projects that don t always fit in with IBM s computer business The lab s research includes efforts to develop an electric car battery that runs 500 miles on one charge a filtration system for desalination and a program that shows changes in geographic data IBM rose 9 cents to 146 04 at 11 02 a m in New York Stock Exchange composite trading The stock had gained 11 percent this year before today Citizen Science The list is meant to give a window into the company s innovation engine said Josephine Cheng a vice president at IBM s Almaden lab All this demonstrates a real culture of innovation at IBM and willingness to devote itself to solving some of the world s biggest problems she said Many of the predictions are based on projects that IBM has in the works One of this year s ideas that sensors in cars wallets and personal devices will give scientists better data about the environment is an expansion of the company s citizen science initiative Earlier this year IBM teamed up with the California State Water Resources Control Board and the City of San Jose Environmental Services to help gather information about waterways Researchers from Almaden created an application that lets smartphone users snap photos of streams and creeks and report back on conditions The hope is that these casual observations will help local and state officials who don t have the resources to do the work themselves Traffic Predictors IBM also sees data helping shorten commutes in the next five years Computer programs will use algorithms and real time traffic information to predict which roads will have backups and how to avoid getting stuck Batteries may last 10 times longer in 2015 than today IBM says Rather than using the current lithium ion technology new models could rely on energy dense metals that only need to interact with the air to recharge Some electronic devices might ditch batteries altogether and use something similar to kinetic wristwatches which only need to be shaken to generate a charge The final prediction involves recycling the heat generated by computers and data centers Almost half of the power used by data centers is currently spent keeping the computers cool IBM scientists say it would be better to harness that heat to warm houses and offices In IBM s first list of predictions compiled at the end of 2006 researchers said instantaneous speech translation would become the norm That hasn t happened yet While some programs can quickly translate electronic documents and instant messages and other apps can perform limited speech translation there s nothing widely available that acts like the universal translator in Star Trek Second Life The company also predicted that online immersive environments such as Second Life would become more widespread While immersive video games are as popular as ever Second Life s growth has slowed Internet users are flocking instead to the more 2 D environments of Facebook Inc and Twitter Inc Meanwhile a 2007 prediction that mobile phones will act as a wallet ticket broker concierge bank and shopping assistant is coming true thanks to the explosion of smartphone applications Consumers can pay bills through their banking apps buy movie tickets and get instant feedback on potential purchases all with a few taps on their phones The nice thing about the list is that it provokes thought Saffo said If everything came true they wouldn t be doing their job To contact the reporter on this story Ryan Flinn in San Francisco at rflinn bloomberg net To contact the editor responsible for this story Tom Giles at tgiles5 bloomberg net by 2015, your mobile phone will project a 3-d image of anyone who calls and your laptop will be powered by kinetic energy. at least that\\u2019s what international business machines corp. sees in its crystal ball."",""url"":""bloomberg news 2010 12 23 ibm predicts holographic calls air breathing batteries by 2015 html""}"', u'"business"', u'"0.789131"', u'"2.055555556"', u'"0.676470588"', u'"0.205882353"', u'"0.047058824"', u'"0.023529412"', u'"0.443783175"', u'"0"', u'"0"', u'"0.09077381"', u'"0"', u'"0.245831182"', u'"0.003883495"', u'"1"', u'"1"', u'"24"', u'"0"', u'"5424"', u'"170"', u'"8"', u'"0.152941176"', u'"0.079129575"', u'"0"']
数据集页面中的数据简介已经告诉我们。前四列分别指的是URL、页面的ID、原始的文本内容和分配给页面的类别。接下来22列包含各种各样的数值或者类属特征。最后一列为目标值, 1为长久, 0为短暂。
我们将用简单的方法直接对数值特征做处理。因为每个类属变量是二元的,对这些变量已有一个用1-of-k编码的特征,于是不需要额外提取特征。
由于数据格式的问题,我们做一些数据清理的工作,在处理过程中把额外的(")去掉。数据集中还有一些用"?"代替的缺失数据,本例中,我们直接用0替换那些缺失数据:
from pyspark.mllib.regression import LabeledPoint
from pyspark.mllib.linalg import Vectors
trimmed = records.map(lambda x: [xx.replace('\"','') for xx in x])
label = trimmed.map(lambda x : x[-1])

data = trimmed.map(lambda x : (x[-1],x[4:-1])).\
               map(lambda (x,y):(x.replace('\"',''),[0.0 if yy=='\"?\"' else yy.replace('\"','') for yy in y])).\
               map(lambda (x,y):(x.replace("\"",""),[0.0 if yy =='?' else yy.replace("\"","") for yy in y])).\
               map(lambda (x,y):(int(x), [float(yy) for yy in y])).\
               map(lambda (x,y):LabeledPoint(x,Vectors.dense(y)))
data.take(5)
[LabeledPoint(0.0, [0.789131,2.055555556,0.676470588,0.205882353,0.047058824,0.023529412,0.443783175,0.0,0.0,0.09077381,0.0,0.245831182,0.003883495,1.0,1.0,24.0,0.0,5424.0,170.0,8.0,0.152941176,0.079129575]),
 LabeledPoint(1.0, [0.574147,3.677966102,0.50802139,0.288770053,0.213903743,0.144385027,0.468648998,0.0,0.0,0.098707403,0.0,0.203489628,0.088652482,1.0,1.0,40.0,0.0,4973.0,187.0,9.0,0.181818182,0.125448029]),
 LabeledPoint(1.0, [0.996526,2.382882883,0.562015504,0.321705426,0.120155039,0.042635659,0.525448029,0.0,0.0,0.072447859,0.0,0.22640177,0.120535714,1.0,1.0,55.0,0.0,2240.0,258.0,11.0,0.166666667,0.057613169]),
 LabeledPoint(1.0, [0.801248,1.543103448,0.4,0.1,0.016666667,0.0,0.480724749,0.0,0.0,0.095860566,0.0,0.265655744,0.035343035,1.0,0.0,24.0,0.0,2737.0,120.0,5.0,0.041666667,0.100858369]),
 LabeledPoint(0.0, [0.719157,2.676470588,0.5,0.222222222,0.12345679,0.043209877,0.446143274,0.0,0.0,0.024908425,0.0,0.228887247,0.050473186,1.0,1.0,14.0,0.0,12032.0,162.0,10.0,0.098765432,0.082568807])]
对数据进行缓存,同时统计数据样本的数目:
data.cache()
numData = data.count()
print numData
7395
在对数据集做进一步处理之前,我们发现数值数据中包含负的特征值。我们知道,朴素贝叶斯模型要求特征值非负,否则碰到负的特征值程序会抛出错误。因此,需要为朴素贝叶斯模型构建一份输入特征向量的数据,将负特征值设为0:
nbdata = trimmed.map(lambda x : (x[-1],x[4:-1])).\
                 map(lambda (x,y):(x.replace('\"',''),[0.0 if yy=='\"?\"' else yy.replace('\"','') for yy in y])).\
                 map(lambda (x,y):(x.replace("\"",""),[0.0 if yy =='?' else yy.replace("\"","") for yy in y])).\
                 map(lambda (x,y):(int(x), [float(yy) for yy in y])).\
                 map(lambda (x,y):(x, [0.0 if yy<0 else yy for yy in y])).\
                 map(lambda (x,y):LabeledPoint(x,Vectors.dense(y)))
nbdata.take(2)
[LabeledPoint(0.0, [0.789131,2.055555556,0.676470588,0.205882353,0.047058824,0.023529412,0.443783175,0.0,0.0,0.09077381,0.0,0.245831182,0.003883495,1.0,1.0,24.0,0.0,5424.0,170.0,8.0,0.152941176,0.079129575]),
 LabeledPoint(1.0, [0.574147,3.677966102,0.50802139,0.288770053,0.213903743,0.144385027,0.468648998,0.0,0.0,0.098707403,0.0,0.203489628,0.088652482,1.0,1.0,40.0,0.0,4973.0,187.0,9.0,0.181818182,0.125448029])]
3 训练分类模型
现在我们已经从数据集中提取了基本的特征并且创建了RDD,接下来开始训练各种模型吧。为了比较不同模型的性能,我们将训练逻辑回归、SVM、朴素贝叶斯和决策树。你会发现每个模型的训练方法几乎一样,不同的是每个模型都有着自己特定可配置的模型参数。MLlib大多数情况下会设置明确的默认值,但实际上,最好的参数配置需要通过评估技术来选择,这个我们会在后续博文中进行讨论。
#导入相应的类
from pyspark.mllib.classification import LogisticRegressionWithSGD
from pyspark.mllib.classification import SVMWithSGD
from pyspark.mllib.classification import NaiveBayes
from pyspark.mllib.tree import DecisionTree

numIteration = 10   #迭代次数
maxTreeDepth = 5    #树的深度

numClass = label.distinct().count()     #类别数
print '类别数:',numClass

#训练逻辑回归、支持向量机、朴素贝叶斯和决策树模型
lrModel = LogisticRegressionWithSGD.train(data, numIteration)
svmModel = SVMWithSGD.train(data, numIteration)
nbModel = NaiveBayes.train(nbdata)
dtModel = DecisionTree.trainClassifier(data,numClass,{},impurity='entropy', maxDepth=maxTreeDepth)
print '逻辑回归模型参数:',lrModel
print '支持向量机模型参数:',svmModel
print '朴素贝叶斯模型参数:',nbModel
print '决策树模型参数:',dtModel
类别数: 2
逻辑回归模型参数: (weights=[-0.110216274454,-0.493200344739,-0.0712665620384,-0.0214744216778,0.00276706475384,0.00246385887598,-1.33300460292,0.0525232672351,0.0,-0.0320576776,-0.00653638798541,-0.0613702511674,-0.14975863133,-0.13648187383,-0.121161700009,-15.6451616669,-0.0177690355464,745.987958686,-7.73567729685,-1.38587998188,-0.0355600416613,-0.0352085128613], intercept=0.0)
支持向量机模型参数: (weights=[-0.122188386978,-0.527510758159,-0.0742371782434,-0.0206667449306,0.00546395033577,0.00409811283781,-1.54824523474,0.0607028905087,0.0,-0.037008323802,-0.007374037142,-0.067970375864,-0.172289581054,-0.148716595522,-0.129369384966,-18.0315472516,-0.0202704220321,1025.48043141,-5.05188911633,-1.54111193167,-0.038689478606,-0.0397619278886], intercept=0.0)
朴素贝叶斯模型参数: <pyspark.mllib.classification.NaiveBayesModel object at 0x11291ab90>
决策树模型参数: DecisionTreeModel classifier of depth 5 with 61 nodes
4 使用分类模型
现在我们有四个在输入标签和特征下训练好的模型,接下来看看如何使用这些模型进行预测。目前,我们将使用同样的训练数据来解释每个模型的预测方法。 此处以逻辑回归模型为例,其他模型的使用方法类似。
dataPoint = data.first()
prediction = lrModel.predict(dataPoint.features)
print '预测的类别:',prediction
print '真实的类别:',int(dataPoint.label)
预测的类别: 1
真实的类别: 0
可以看到对于训练数据中第一个样本,模型预测值为1,即长久。 但该样本的真实值为0。我们建立的逻辑回归模型预测出错了!
如果要对所有的样本做预测,将RDD[Vector]整体作为输入即可:
predictions = lrModel.predict(data.map(lambda x : x.features))
print '前十个样本的预测标签:',predictions.take(10)
print '前十个样本的真实标签:',data.map(lambda x : x.label).map(lambda x: int(x)).take(10)
前十个样本的预测标签: [1, 1, 1, 1, 1, 1, 1, 1, 1, 1]
前十个样本的真实标签: [0, 1, 1, 1, 0, 0, 1, 0, 1, 1]
5 评估分类模型的性能
在使用模型做预测时,如何知道预测到底好不好呢?换句话说,应该知道怎么评估模型性能。通常在二分类中使用的评估方法包括:预测正确率和错误率、准确率和召回率、准确率召回率曲线下方的面积、ROC曲线、ROC曲线下的面积和F-Measure。
5.1 预测的正确率和错误率
在二分类中,预测正确率可能是最简单评测方式,正确率等于训练样本中被正确分类的数目除以总样本数。类似地,错误率等于训练样本中被错误分类的样数目除以总样本数。
我们通过对输入特征进行预测并将预测值与实际标签进行比较,计算出模型在训练数据上的正确率。将对正确分类的样本数目求和并除以样本总数,得到平均分类正确率:
#逻辑回归模型模型的预测正确数目
lrTotalCorrect = data.map(lambda point : 1 if(lrModel.predict(point.features)==point.label) else 0).sum()
#支持向量机模型的预测正确数目
svmTotalCorrect = data.map(lambda point : 1 if(svmModel.predict(point.features)==point.label) else 0).sum()
#朴素贝叶斯模型的预测正确数目
nbTotalCorrect = nbdata.map(lambda point : 1 if (nbModel.predict(point.features) == point.label) else 0).sum()

#决策树模型的预测正确数目
predictLabel= dtModel.predict(data.map(lambda point: point.features)).collect()
trueLabel = data.map(lambda point: point.label).collect()
dtTotalCorrect = sum([1.0 if prediction == trueLabel[i] else 0.0 for i, prediction in enumerate(predictLabel)])

#逻辑回归模型模型的预测正确率
lrAccuracy = lrTotalCorrect/(data.count()*1.0)
#支持向量机模型的预测正确率
svmAccuracy = svmTotalCorrect/(data.count()*1.0)
#朴素贝叶斯模型的预测正确率
nbAccuracy = nbTotalCorrect/(1.0*nbdata.count())
#决策树模型的预测正确率
dtAccuracy = dtTotalCorrect/(1.0*data.count())
print '总共的样本数目: %s'%data.count()
print '逻辑回归模型模型的预测正确率: %s'%lrAccuracy
print '支持向量机模型的预测正确率: %f'%svmAccuracy
print '朴素贝叶斯模型的预测正确率: %f'%nbAccuracy
print '决策树模型的预测正确率: %f'%dtAccuracy
总共的样本数目: 7395
逻辑回归模型模型的预测正确率: 0.514672075727
支持向量机模型的预测正确率: 0.514672
朴素贝叶斯模型的预测正确率: 0.580392
决策树模型的预测正确率: 0.648276
从上述预测结果可知,逻辑回归、SVM和朴素贝叶斯模型性能都较差,而决策树模型正确率是65%,但还不是很高。
5.2 准确率和召回率
在信息检索中,准确率通常用于评价结果的质量,而召回率用来评价结果的完整。
在二分类问题中,准确率定义为真阳性的数目除以真阳性和假阳性的总数,其中真阳性是指被正确预测的类别为1的样本,假阳性是错误预测为类别1的样本。如果每个被分类器预测为类别1的样本确实属于类别1,那准确率达到100%。
召回率定义为真阳性的数目除以真阳性和假阴性的和,其中假阴性是类别为1却被预测为0的样本。如果任何一个类型为1的样本没有被错误预测为类别0(即没有假阴性),那召回率达到100%。
通常,准确率和召回率是负相关的,高准确率常常对应低召回率,反之亦然。为了说明这点,假定我们训练了一个模型的预测输出永远是类别1。因为总是预测输出类别1,所以模型预测结果不会出现假阴性,这样也不会错过任何类别1的样本。于是,得到模型的召回率是1.0。另一方面,假阳性会非常高,意味着准确率非常低(这依赖各个类别在数据集中确切的分布情况)。
准确率和召回率在单独度量时用处不大,但是它们通常会被一起组成聚合或者平均度量。二者同时也依赖于模型中选择的阈值。
直觉上来讲,当阈值低于某个程度,模型的预测结果永远会是类别1。因此,模型的召回率为1,但是准确率很可能很低。相反,当阈值足够大,模型的预测结果永远会是类别0。此时,模型的召回率为0,但是因为模型不能预测任何真阳性的样本,很可能会有很多的假阴性样本。不仅如此,因为这种情况下真阳性和假阳性为0,所以无法定义模型的准确率。
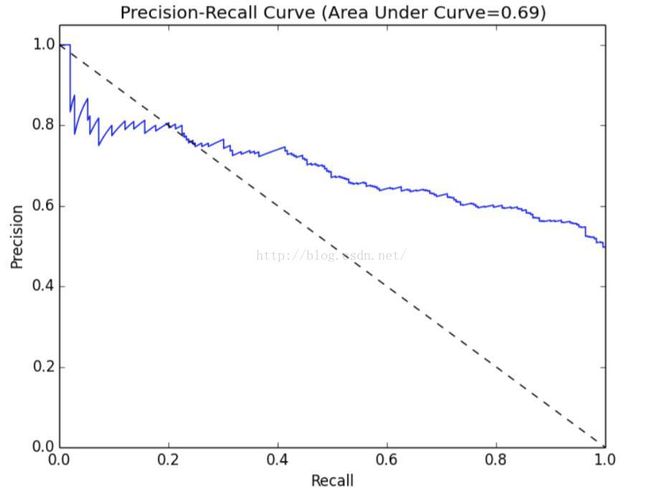
如图所示的准确率-召回率(PR)曲线,表示给定模型随着决策阈值的改变,准确率和召回率的对应关系。PR曲线下的面积为平均准确率。直觉上,PR曲线下的面积为1等价于一个完美模型,其准确率和召回率达到100%。

5.3 ROC曲线和AUC
ROC曲线在概念上和PR曲线类似,它是对分类器的真阳性率假阳性率的图形化解释 。
真阳性率(TPR)是真阳性的样本数除以真阳性和假阴性的样本数之和。换句话说,TPR是真阳性数目占所有正样本的比例。这和之前提到的召回率类似,通常也称为敏感度。
假阳性率(FPR)是假阳性的样本数除以假阳性和真阴性的样本数之和。换句话说,FPR是假阳性样本数占所有负样本总数的比例。
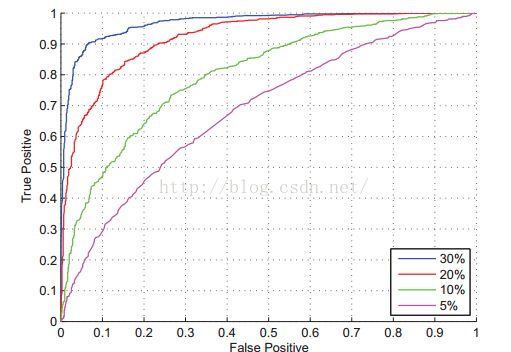
和准确率和召回率类似,ROC曲线(下图)表示了分类器性能在不同决策阈值下TPR对FPR的折衷。曲线上每个点代表分类器决策函数中不同的阈值。
ROC下的面积(通常称作AUC)表示平均值。同样,AUC为1.0时表示一个完美的分类器,0.5则表示一个随机的性能。于是,一个模型的AUC为0.5时和随机猜测效果一样。
MLlib内置了一系列方法用来计算二分类的PR和ROC曲线下的面积。下面我们针对每一个模型来计算这些指标:
# 模型评价
from pyspark.mllib.evaluation import BinaryClassificationMetrics
all_models_metrics = []
for model in [lrModel, svmModel]:
    scoresAndLabels = data.map(lambda point:(model.predict(point.features), point.label)).collect()
    scoresAndLabels = [[float(i),j] for i,j in scoresAndLabels]

    rdd_scoresAndLabels = sc.parallelize(scoresAndLabels)   #将数据转换为rdd
    metrics = BinaryClassificationMetrics(rdd_scoresAndLabels)
    all_models_metrics.append((model.__class__.__name__, metrics.areaUnderROC, metrics.areaUnderPR))

for modelName, AUC, PR in all_models_metrics:
    print '%s的AUC是%f,PR是%f'%(modelName, AUC, PR)
LogisticRegressionModel的AUC是0.501418,PR是0.756759
SVMModel的AUC是0.501418,PR是0.756759
之前已经训练朴素贝叶斯模型并计算准确率,其中使用的数据集是nbData,这里使用同样的数据集进行模型评价。
scoresAndLabels = nbdata.map(lambda point:(nbModel.predict(point.features), point.label)).collect()
scoresAndLabels = [[float(i),j] for i,j in scoresAndLabels]

rdd_scoresAndLabels = sc.parallelize(scoresAndLabels)   #将数据转换为rdd
nb_metric = BinaryClassificationMetrics(rdd_scoresAndLabels)

print '%s的AUC是%f,PR是%f'%(nbModel.__class__.__name__, nb_metric.areaUnderROC, nb_metric.areaUnderPR)
NaiveBayesModel的AUC是0.583559,PR是0.680851
因为DecisionTreeModel模型没有实现其他三个模型都有的ClassificationModel接口,因此需要单独拿出来计算:
predictionLabels = dtModel.predict(data.map(lambda point: point.features)).collect()
trueLabels = data.map(lambda point: point.label).collect()
scoresAndLabels = [[prediction, trueLabel] for prediction,trueLabel in zip(predictionLabels, trueLabels)]
scoresAndLabels = [[float(i),j] for i,j in scoresAndLabels]
rdd_scoresAndLabels = sc.parallelize(scoresAndLabels)

dt_metric = BinaryClassificationMetrics(rdd_scoresAndLabels)
print '%s的AUC是%f,PR是%f'%(dtModel.__class__.__name__, dt_metric.areaUnderROC, dt_metric.areaUnderPR)
DecisionTreeModel的AUC是0.648837,PR是0.743081
从上述结果可知,逻辑回归和SVM的AUC的结果在0.5左右,表明这两个模型并不比随机好。朴素贝叶斯模型和决策树模型性能稍微好些,AUC分别是0.58和0.65。但是,在二分类问题上这个性能并不是非常好。
非常感谢能够坚持看到此处的童鞋,你们的认可是我继续写下去的最大动力,由于本文篇幅较长,因此,分为上下两部分。如果对本文讨论的主题还有兴趣,请关注下半部分 spark机器学习系列:(五)用Spark Python构建分类模型(下) 。

