scikit-learn : 线性回归
# 线性回归背景 从线性回归(Linear regression)开始学习回归分析,线性回归是最早的也是最基本的模型——把数据拟合成一条直线。 — # 数据集 使用scikit-learn里的数据集boston,boston数据集很适合用来演示线性回归。boston数据集包含了波士顿地区的房屋价格中位数。还有一些可能会影响房价的因素,比如犯罪率(crime rate)。 ## 加载数据
from sklearn import datasets
boston = datasets.load_boston()import pandas as pd
import warnings # 用来忽略seaborn绘图库产生的warnings
warnings.filterwarnings("ignore")
import seaborn as sns
import matplotlib.pyplot as plt
sns.set(style="white", color_codes=True)
%matplotlib inlinedef skdata2df(skdata):
dfdata = pd.DataFrame(skdata.data,columns=skdata.feature_names)
dfdata["target"] = skdata.target
return dfdatabs = skdata2df(boston)bs.head()| CRIM | ZN | INDUS | CHAS | NOX | RM | AGE | DIS | RAD | TAX | PTRATIO | B | LSTAT | target | |
|---|---|---|---|---|---|---|---|---|---|---|---|---|---|---|
| 0 | 0.00632 | 18.0 | 2.31 | 0.0 | 0.538 | 6.575 | 65.2 | 4.0900 | 1.0 | 296.0 | 15.3 | 396.90 | 4.98 | 24.0 |
| 1 | 0.02731 | 0.0 | 7.07 | 0.0 | 0.469 | 6.421 | 78.9 | 4.9671 | 2.0 | 242.0 | 17.8 | 396.90 | 9.14 | 21.6 |
| 2 | 0.02729 | 0.0 | 7.07 | 0.0 | 0.469 | 7.185 | 61.1 | 4.9671 | 2.0 | 242.0 | 17.8 | 392.83 | 4.03 | 34.7 |
| 3 | 0.03237 | 0.0 | 2.18 | 0.0 | 0.458 | 6.998 | 45.8 | 6.0622 | 3.0 | 222.0 | 18.7 | 394.63 | 2.94 | 33.4 |
| 4 | 0.06905 | 0.0 | 2.18 | 0.0 | 0.458 | 7.147 | 54.2 | 6.0622 | 3.0 | 222.0 | 18.7 | 396.90 | 5.33 | 36.2 |
bs.describe()| CRIM | ZN | INDUS | CHAS | NOX | RM | AGE | DIS | RAD | TAX | PTRATIO | B | LSTAT | target | |
|---|---|---|---|---|---|---|---|---|---|---|---|---|---|---|
| count | 506.000000 | 506.000000 | 506.000000 | 506.000000 | 506.000000 | 506.000000 | 506.000000 | 506.000000 | 506.000000 | 506.000000 | 506.000000 | 506.000000 | 506.000000 | 506.000000 |
| mean | 3.593761 | 11.363636 | 11.136779 | 0.069170 | 0.554695 | 6.284634 | 68.574901 | 3.795043 | 9.549407 | 408.237154 | 18.455534 | 356.674032 | 12.653063 | 22.532806 |
| std | 8.596783 | 23.322453 | 6.860353 | 0.253994 | 0.115878 | 0.702617 | 28.148861 | 2.105710 | 8.707259 | 168.537116 | 2.164946 | 91.294864 | 7.141062 | 9.197104 |
| min | 0.006320 | 0.000000 | 0.460000 | 0.000000 | 0.385000 | 3.561000 | 2.900000 | 1.129600 | 1.000000 | 187.000000 | 12.600000 | 0.320000 | 1.730000 | 5.000000 |
| 25% | 0.082045 | 0.000000 | 5.190000 | 0.000000 | 0.449000 | 5.885500 | 45.025000 | 2.100175 | 4.000000 | 279.000000 | 17.400000 | 375.377500 | 6.950000 | 17.025000 |
| 50% | 0.256510 | 0.000000 | 9.690000 | 0.000000 | 0.538000 | 6.208500 | 77.500000 | 3.207450 | 5.000000 | 330.000000 | 19.050000 | 391.440000 | 11.360000 | 21.200000 |
| 75% | 3.647423 | 12.500000 | 18.100000 | 0.000000 | 0.624000 | 6.623500 | 94.075000 | 5.188425 | 24.000000 | 666.000000 | 20.200000 | 396.225000 | 16.955000 | 25.000000 |
| max | 88.976200 | 100.000000 | 27.740000 | 1.000000 | 0.871000 | 8.780000 | 100.000000 | 12.126500 | 24.000000 | 711.000000 | 22.000000 | 396.900000 | 37.970000 | 50.000000 |
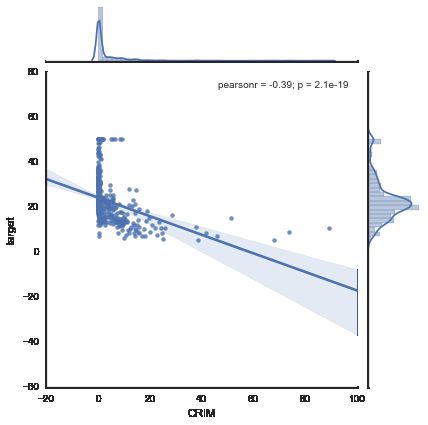
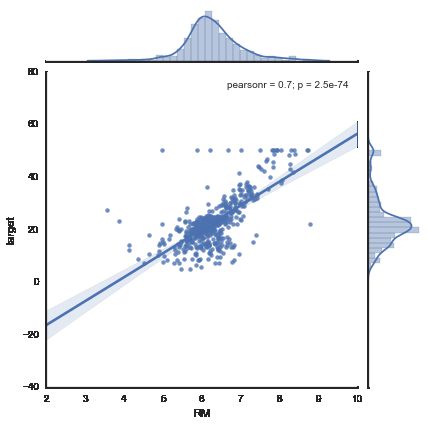
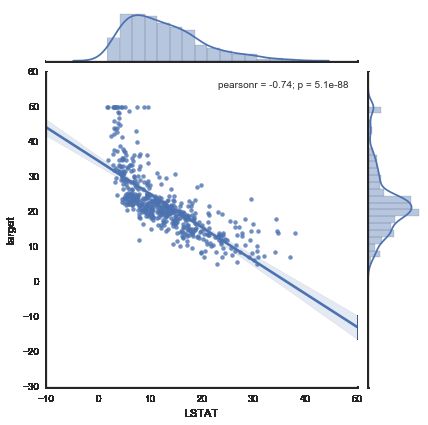
fig = plt.figure()
for i,f in enumerate(boston.feature_names):
    sns.jointplot(x=f, y="target", data=bs, kind='reg', size=6)
线性回归模型
用scikit-learn的线性回归非常简单
首先,导入LinearRegression类创建一个对象:
from sklearn.linear_model import LinearRegression
lr = LinearRegression()
现在,再把自变量和因变量传给LinearRegression的fit方法:
lr.fit(boston.data, boston.target)LinearRegression(copy_X=True, fit_intercept=True, n_jobs=1, normalize=False)
现在开始预测
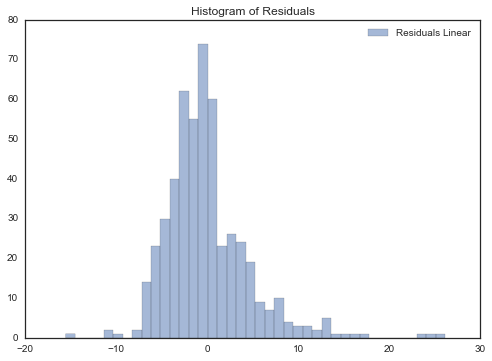
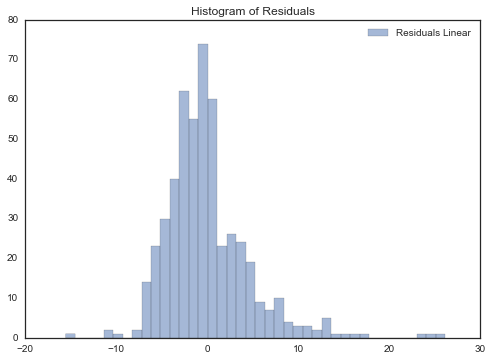
predictions = lr.predict(boston.data)用预测值与实际值的残差(residuals)直方图分布来直观显示预测结果:
%matplotlib inline
f, ax = plt.subplots(figsize=(7, 5))
f.tight_layout()
ax.hist(boston.target-predictions,bins=40, label='Residuals Linear', color='b', alpha=.5);
ax.set_title("Histogram of Residuals")
ax.legend(loc='best');
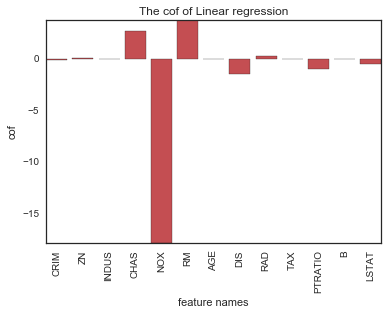
查看相关系数
lr.coef_array([ -1.07170557e-01, 4.63952195e-02, 2.08602395e-02,
2.68856140e+00, -1.77957587e+01, 3.80475246e+00,
7.51061703e-04, -1.47575880e+00, 3.05655038e-01,
-1.23293463e-02, -9.53463555e-01, 9.39251272e-03,
-5.25466633e-01])
list(zip(boston.feature_names, lr.coef_))[('CRIM', -0.1071705565603549),
('ZN', 0.046395219529801912),
('INDUS', 0.020860239532175279),
('CHAS', 2.6885613993180009),
('NOX', -17.79575866030935),
('RM', 3.8047524602580065),
('AGE', 0.00075106170332261968),
('DIS', -1.4757587965198196),
('RAD', 0.3056550383391009),
('TAX', -0.012329346305275379),
('PTRATIO', -0.95346355469056254),
('B', 0.0093925127221887728),
('LSTAT', -0.52546663290078754)]
用条形图直观查看相关系数
def plotCofBar(x_feature,y_cof):
    x_value = range(len(x_feature))
    plt.bar(x_value, y_cof, alpha = 1, color = 'r', align="center")
    plt.autoscale(tight=True)
    plt.xticks([i for i in range(len(x_feature))],x_feature,rotation="90")
    plt.xlabel("feature names")
    plt.ylabel("cof")
    plt.title("The cof of Linear regression")
plt.show()plotCofBar(boston.feature_names,lr.coef_)线性回归原理
线性回归的基本理念是找出满足 y=Xβ 的相关系数集合 β ,其中 X 是因变量数据矩阵。想找一组完全能够满足等式的相关系数很难,因此通常会增加一个误差项表示不精确程度或测量误差。因此,方程就变成了 y=Xβ+ϵ ,其中 ϵ 被认为是服从正态分布且与 X 独立的随机变量。用几何学的观点描述,就是说这个变量与 X 是正交的(perpendicular)。可以证明 E(Xϵ)=0 。
为了找到相关系数集合 β ,我们最小化误差项,这转化成了残差平方和最小化问题。
这个问题可以用解析方法解决,其解是:
β=(XTX)−1XTy^
线性回归可以自动标准正态化(normalize或scale)输入数据
回归模型都可以实现自动标准正态化输入数据,但是像KNN这种模型数据标准正态化前后性能差别很大。参考我的另一篇文章
lr2 = LinearRegression(normalize=True)
lr2.fit(boston.data, boston.target)
LinearRegression(copy_X=True, fit_intercept=True, n_jobs=1, normalize=True)
predictions2 = lr2.predict(boston.data)
%matplotlib inline
from matplotlib import pyplot as plt
f, ax = plt.subplots(figsize=(7, 5))
f.tight_layout()
ax.hist(boston.target-predictions2,bins=40, label='Residuals Linear', color='b', alpha=.5);
ax.set_title("Histogram of Residuals")
ax.legend(loc='best');
import numpy as np
print "after normalize:",np.percentile(boston.target-predictions2, 75)
print "before normalize:",np.percentile(boston.target-predictions,75)after normalize: 1.78311579433
before normalize: 1.78311579433
从上面分位数看没有任何差别。
