机器学习(周志华)课后作业/习题答案
前言:本系列作业系笔者个人主观完成,一家之言因此难免有不当之处,仅供参考。此外笔者只完成部分认为有用的问题。
李航《统计学习方法》答案见:统计学习方法
持续更新中…
第一章
1.1
通常情况下,版本空间是正例的泛化。在我们确定学习目标之后(比如找到“好瓜”,视为正例),可能有多个假设(hypothesis)是跟我们的目标一致的,满足训练集。也就是说可能有多种假设满足我们“好瓜”的要求。因此版本空间就是所有满足这个正例的结果的集合。因而我们的方法是:先把假设空间(hypothesis space)找出来,然后踢出与正例不一致的假设。或者直接找出能够实现正例的hypothesis,我打算用后者。
假如只有编号1和4两个样例,则考虑通配符*和空集 ϕ \phi ϕ. 所以hypothesis space的规模为: 3 × 3 × 3 + 1 = 28 3\times3\times3+1=28 3×3×3+1=28。
对着第四页的表1.1,能够实现正例的hypothesis(即能够找到好瓜的)有:
- {青绿 蜷缩 浊响}
上面是限制最强的,即最没有泛化的情况,在这种情况下慢慢往外推,有:
一个通配符的: - {* 蜷缩 浊响}
- {青绿 * 浊响}
- {青绿 蜷缩 *}
两个通配符的 - {* * 浊响}
- {* 蜷缩 *}
- {青绿 * *}
因此有7中情况
第二章
2.1
这是一个排列组合问题。有1000个样本,500个正例,500个反例。那么我们先考虑训练集,因为训练集一旦定了,那么剩下的样本就都放测试集,也就是测试集也定了。
在留出法中,要保持测试集和训练集的类别比列相似,也就是分层采样。因此训练集需要350个正例,350个反例。即
C 500 350 × C 500 350 C^{350}_{500}\times C^{350}_{500} C500350×C500350
2.2
数据包含100个样例,使用10折交叉验证,则依据分层采样。分成十份,每份有5个正例5个反例。则训练集是十份中的9份,每份的正反例是一样的,此时依照题目随机猜,因此错误率为50%。
当使用留一法:表示将100个样例分成100份。假设测试集是一个正例,那么训练集中有50个反例和一个正例,那么学习算法学得的模型将会把测试集判断为反例,判断错误。留下的是反例亦然。错误率100%。
2.3
对这个题始终还有疑问,即这个题是否提问得恰当?
P-R曲线的由来如P31页所述。是对样例先进行排序,拍在前面是最可能正例的样本,后面是最不可能正例的样本,然后按顺序逐个把正例进行预测,每次预测都可以计算出当前的查全率和查准率(亦即每次都可以有F1),并画出P-R图。如此到题中,若学习器A的F1值比学习器B高。说的是某次计算中A的F1大于B的F1,(并不是所有的次数A都大于B,因为实际实验只做一次),此时题目问的却是A的BEP值是否比B高。这个值显然是不知道的。因为BEP值要求P=R,而F1的定义是
1 F 1 = 1 2 × ( 1 P + 1 R ) \frac{1}{F1}=\frac{1}{2}\times\left(\frac{1}{P}+\frac{1}{R}\right) F11=21×(P1+R1)
注意此时的P和R不是相等的。因此结果是未知的。
第三章
课文整理/代码实现部分
此部分目的在于通过现有程序来实现线性模型对测试集的预估。
求解过程中使用的梯度下降算法可以见:梯度下降法
第三章主要讲了线性模型,基本形式为:
f ( x ) = w T x + b f(\boldsymbol x)=\boldsymbol w^T\boldsymbol x+b f(x)=wTx+b详细过程会在代码中解释清楚。
# import packages that may be used
import numpy as np
import matplotlib.pyplot as plt
from sklearn import linear_model
from sklearn import datasets
from sklearn.metrics import mean_squared_error,r2_score

#make data linear regression from datasets
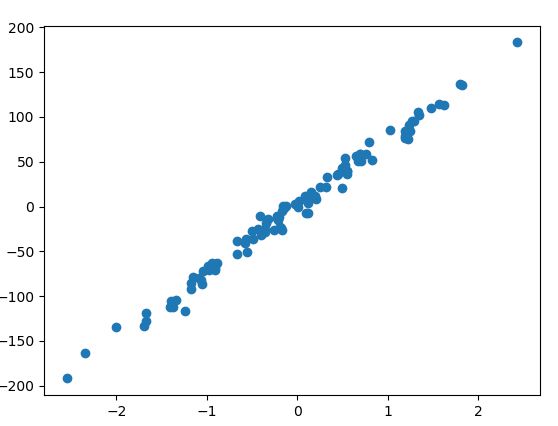
X,Y = datasets.make_regression(n_samples=100, n_features=1, n_targets=1, noise=8)
plt.scatter(X,Y)
plt.show()

#split the data into training/testing sets
X_train = X[:-30]
X_test = X[-30:]

#split the targets into training/testing sets
Y_train = Y[:-30]
Y_test = Y[-30:]

#create linear regression object
reg = linear_model.LinearRegression()

#Train the model using the training sets
reg.fit(X_train,Y_train)

#Make predictions using the testing set
test_pred = reg.predict(X_test)

# The coefficients
print('coefficients >> %.3f, intercept >> %.3f '%(reg.coef_, reg.intercept_))

# The mean sqwared error
print('Mean squared error for testing set: %.3f' %mean_squared_error(Y_test,test_pred))

# Explained variance score: 1 is perfect prediction
print('Variance score:%.2f'%r2_score(Y_test,test_pred))
print("variance score:%.2f" % reg.score(X_test, Y_test))
说明:
1)R2_score等于1是最好的结果(可看线性模型的链接内容,sklearn.linear_model.LinearRegression)
2)上面使用的实例只有一个feature/attribute, 从结果来看,线性方程形式为:
f ( x ) = 73.497 x + 0.392 f(x)=73.497x+0.392 f(x)=73.497x+0.392
比如我再预测一个当x=3时的f(x)值
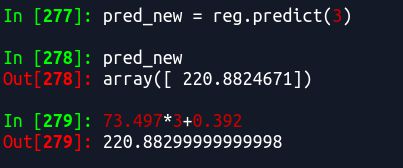
结果是一样的(小数点后不同是因为我上面输出保留的是3位小数)
对于线性模型可以看这个链接sklearn.linear_model.LinearRegression
例子可以看linearRegression example
以上数据是datasets生成的,对于自己使用的数据可以如下:
# import packages that may be used
import numpy as np
from sklearn import linear_model

#make data linear regression from datasets
x1 = [0,1,2.2,3,3.4,5,8,10,13,15]
x2 = [2,3,4,5,2,3,4,5,18,23]

X = np.array([[0,2],[1,3],[2.2,4],[3,5],[3.4,2],[5,3],[6,4],[10,5],[13,18],[15,23]])

# y = 2+3*x1+7*x2
Y = 2+np.dot(X,np.array([3,2]))

#create linear regression object
reg = linear_model.LinearRegression()

#Train the model using the training sets
reg.fit(X,Y)

#Make predictions using the testing set
test_pred = reg.predict(np.array([[4,2]]))

# The coefficients
print('coefficients and intercept >> ',(reg.coef_, reg.intercept_))
3.1
偏置项对于研究 f ( x ) f(x) f(x)与 x x x之间的关系没有影响,只相当于坐标系从坐标原点移动了 b b b距离。如
f ( x ) = a x + b f(x)=ax+b f(x)=ax+b中 x x x与 f ( x ) f(x) f(x)是一次关系,斜率为 a a a, b b b只是相当于坐标系从原点上移了 b b b距离。因此在研究 f ( x ) f(x) f(x)与 x x x之间的关系时, b b b无关紧要。数学上,既然是移动了坐标系,也可以通过将坐标系移动回到原点即可消除 b b b的影响。通过将所有数据减去数据中的同一个数据可以达到效果,即
f ( x i − x 0 ) = w T ( x i − x 0 ) f(\boldsymbol x_i-x_0)=\boldsymbol w^T(\boldsymbol x_i-x_0) f(xi−x0)=wT(xi−x0)
举例如下:
# import packages that may be used
import numpy as np
from sklearn import linear_model

#make data linear regression from datasets
x1 = [0,1,2.2,3,3.4,5,8,10,13,15]
x2 = [2,3,4,5,2,3,4,5,18,23]

X = np.array([[0,2],[1,3],[2.2,4],[3,5],[3.4,2],[5,3],[6,4],[10,5],[13,18],[15,23]])

# y = 2+3*x1+7*x2
Y = 2+np.dot(X,np.array([3,7]))

#new data
X = X-X[0]
Y = Y-Y[0]
#create linear regression object
reg = linear_model.LinearRegression()

#Train the model using the training sets
reg.fit(X,Y)

#Make predictions using the testing set
test_pred = reg.predict(np.array([[4,2]]))
print('prediction_test',test_pred)

# The coefficients
print('coefficients and intercept >> ',(reg.coef_, reg.intercept_))
3.2
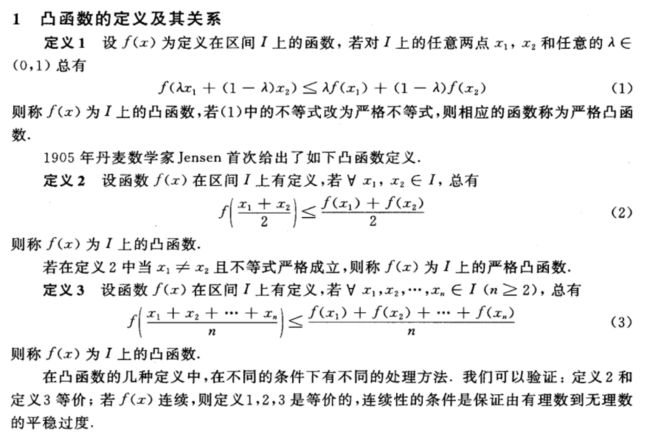
首先给出凸函数(convex function)的定义和性质
顺便一提,也有凹函数的定义(凸函数和凸优化):
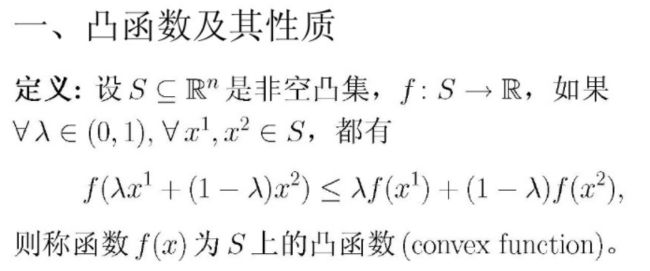
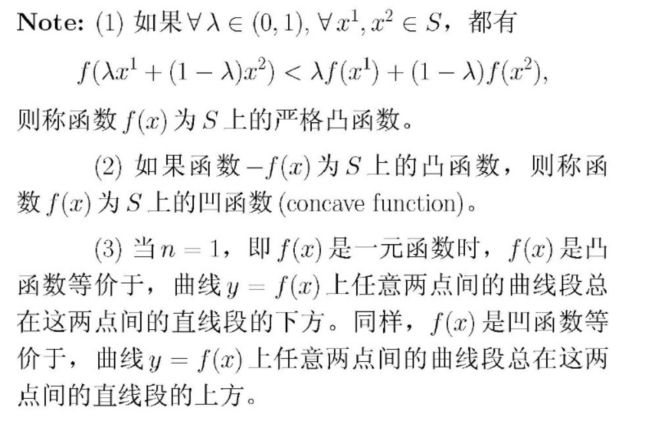
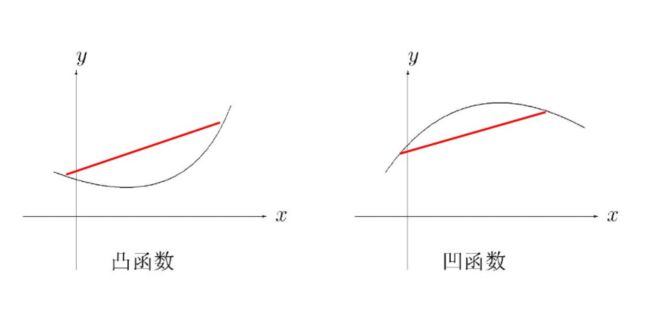
note:
- 严格凸函数:二阶导数在区间上恒大于0
- U形曲线函数如 y = x 2 y=x^2 y=x2通常是凸函数
性质:
凸函数的局部最优解是全局最优解,任何极小值也是全局最小值。严格凸函数最多有一个最小值,即最优解唯一。
凸函数的证明方法
- 通过定义式
- 对于连续凸函数,通过求两阶导,如果两阶导在区间上非负,则是凸函数
参考文献:
1 关于凸函数的定义和性质
2 凸函数和凸优化
3.3
2. 通过导入包的方法
先对数据scatter出来,有一个整体印象
# import packages that may be used
import numpy as np
import matplotlib.pyplot as plt

#make data linear regression from datasets
dataset = np.loadtxt(r'/media/sf_Share/Machine learning/zhouzhihua_solutions/3/watermelon_3.0a.txt')

# plot data
X = dataset[:,1:3]
Y = dataset[:,3]
plt.scatter(X[Y == 0,0], X[Y == 0,1], marker = 'o', color = 'k', s=30, label = 'NO')   #scatter the data where Y=0
plt.scatter(X[Y == 1,0], X[Y == 1,1], marker = 'o', color = 'g', s=30, label = 'YES')  #scatter the data where Y=1
plt.legend(loc = 'upper right')

plt.show()
从sklearn导入包,并将数据部分作为训练部分作为预测
# import packages that may be used
import numpy as np
from sklearn import linear_model
import matplotlib.pyplot as plt
from sklearn.model_selection import train_test_split
from sklearn.metrics import mean_squared_error,r2_score

#make data linear regression from datasets
dataset = np.loadtxt(r'/media/sf_Share/Machine learning/zhouzhihua_solutions/3/watermelon_3.0a.txt')

#split dataset to training/testing sets
train_data, test_data = train_test_split(dataset,test_size=0.3, random_state=0)
X_train = train_data[:,1:3]
Y_train = train_data[:,3]
X_test = test_data[:,1:3]
Y_test = test_data[:,3]

#create logistic regression object
reg = linear_model.LogisticRegression()

#Train the model using the training sets
reg.fit(X_train,Y_train)

#Make predictions using the testing set
test_pred = reg.predict(X_test)
print('prediction_test',test_pred)

# The coefficients
coeffs = reg.coef_
b = reg.intercept_
print('coefficients and intercept >> ',(reg.coef_, reg.intercept_))

# The mean sqwared error
print('Mean squared error for testing set: %.3f' %mean_squared_error(Y_test,test_pred))

# Explained variance score: 1 is perfect prediction
print('Variance score:%.2f'%r2_score(Y_test,test_pred))
print("variance score:%.2f" % reg.score(X_test, Y_test))
需要的数据如下:
总的数据

训练数据为:

测试数据为:
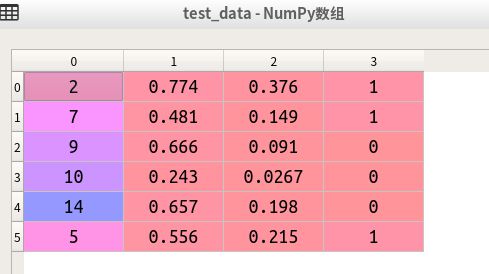
最后给出的结果

从结果来看,测试很差,给出的预测都是0(即不是好瓜),而真实数据有三个好瓜,三个不是好瓜。
note:
- train_data, test_data = train_test_split(dataset,test_size=0.3, random_state=0)这里可以将test_size=0.3改为=3,表示有3个用于测试
