React+React-Route+Antd+Recharts+Excel(获取Excel数据,绘制Charts)
转眼间2018年就过去了,来到的2019新的一年,在这里,祝大家新年快乐。

知乎
个人博客
Github
Demo
Repo
开发缘由:因为一个很重要的朋友需要绘制一些Charts,但是嫌弃手绘太慢,因此这次放假写了这个小东西
当前进度:简单的Demo Charts展示,包括AreaChart, BarChart, ComposedChart, LineChart, PieChart
测试文件:src/common/files/info.xlsx
附上
- Recharts
- React-Route
先上两张照片吧


1、版本


2、创建项目
因为公司使用的 react+antd+ts, 虽然antd前两天搞了个圣诞惊吓,但是毋庸置疑,这个组件库做的确实很好啊,我不怕被喷,辩证一分为二,不能因为别人犯一点的错误,就否认人家吧,废话不多说,还是讲本文的主题吧
首先先安装create-react-app
npm i -g create-react-app
create-react-app Charts --scripts-version=react-scripts-ts-antd
然后安装react-route-dom和recharts
yarn add react-route-dom
or
npm i react-route-dom --save
npm i recharts --save
因为TS检查较为严格,所以,我对TS有一些我自己需要rules的配置
tslint.js
{
  "extends": ["tslint:recommended", "tslint-react", "tslint-config-prettier"],
  "linterOptions": {
    "exclude": [
      "config/**/*.js",
      "node_modules/**/*.ts",
      "coverage/lcov-report/*.js"
    ]
  },
  "rules": {
    "no-string-throw": true,
    "no-unused-expression": false,
		"no-unused-variable": false,
    "no-use-before-declare": false,
    "no-duplicate-variable": false,
    "curly": true,
    "class-name": true,
    "triple-equals": [true, "allow-null-check"],
    "comment-format": [false, "check-space"],
    "eofline": true,
    "forin": false,
    "indent": [true, "spaces", 2],
    "label-position": true,
    "max-line-length": [true, 150],
    "member-access": false,
    "no-arg": true,
    "no-bitwise": false,
    "no-console": [true,
      "debug",
      "info",
      "time",
      "timeEnd",
      "trace"
    ],
    "no-construct": true,
    "no-debugger": true,
    "no-empty": false,
    "no-eval": true,
    "no-inferrable-types": true,
    "no-shadowed-variable": false,
    "no-string-literal": false,
    "no-switch-case-fall-through": false,
    "no-trailing-whitespace": true,
    "no-var-keyword": false,
    "object-literal-sort-keys": false,
    "one-line": [true,
      "check-open-brace",
      "check-catch",
      "check-else"
    ],
    "radix": false,
    "typedef-whitespace": [true, {
      "call-signature": "nospace",
      "index-signature": "nospace",
      "parameter": "nospace",
      "property-declaration": "nospace",
      "variable-declaration": "nospace"
    }],
    "variable-name": [true, "ban-keywords"],
    "whitespace": [true,
      "check-branch",
      "check-decl",
      "check-type",
      "check-preblock"
    ],
    "ordered-imports": false,
    "jsx-no-lambda": false,
    "interface-name": [true, "never-prefix"],
    "prefer-const": false
  }
}
TS初试
React-Route 4.x提供给我们使用的都是以组件形式存在的。我们使用的时候就像我们以前使用组件那样使用就行了,详见React-Route官方文档。

菜单栏,我觉得日后可能还会增加其他的Charts,所以我将菜单通过配置文件来控制,增加复用性。
SideMenu.tsx
import React, { Component } from 'react';
import { Link } from 'react-router-dom';
import classnames from 'classnames';
import moment from 'moment';
import './index.scss';
import { menus } from './menus';
import { Layout, Menu, Icon } from 'antd';
import Timer from 'src/components/Timer/Timer';
const { Header, Footer, Sider, Content } = Layout;
const { SubMenu } = Menu;
interface SideMenuProps {
children?: any;
}
export default class SideMenu extends Component {
public state = {
collapsed: false,
selectedKeys: [menus[0].key],
};
public toggle = () => {
this.setState({
collapsed: !this.state.collapsed
});
};
render() {
const { collapsed, selectedKeys, } = this.state
return (
{this.props.children}
);
}
}
Menu.ts
/*
 * @Author: Rainy
 * @Github: https://github.com/Rain120
 * @Date: 2018-12-30 15:43:12
 * @LastEditTime: 2018-12-31 13:28:04
 */

export const menus = [
  {
    key: 'menu-0',
    icon: 'bar-chart',
    text: 'Charts Demo Show',
    path: '/',
  },
  {
    key: 'menu-1',
    icon: 'dashboard',
    text: 'ReCharts',
    children: [
      {
        key: '1',
        text: 'Charts Drawer',
        path: '/charts/charts-drawer'
      },
    ]
  }
] as any;
获取Excel的数据是通过使用大佬的xlsx插件来实现的,详见XLSX官网。
npm i xlsx -S

因为这次项目没有后端,所以其实我们对Excel文件的解析是在upload之前完成的
public beforeUpload = (file: any, fileList: any) => {
    var rABS = true;
    const f = fileList[0];
    var reader = new FileReader();
    reader.onload = (e: any) => {
        let data: any = e.target.result;
        if (!rABS) {
          data = new Uint8Array(data);
        }
        var workbook = XLSX.read(data, {
            type: rABS ? 'binary' : 'array'
        });
        // more sheet
        workbook.SheetNames.map(item => {
          var worksheet = workbook.Sheets[item];
          var jsonArr = XLSX.utils.sheet_to_json(worksheet, { header: 1 });
          this.handleImpotedJson(jsonArr);
        })
    };
    if (rABS) {
      reader.readAsBinaryString(f);
    } else {
      reader.readAsArrayBuffer(f);
    }
    return false;
}
upload config
const props = {
      accept: 'application/vnd.openxmlformats-officedocument.spreadsheetml.sheet',
      name: 'file',
      headers: {
        authorization: 'authorization-text',
      },
      multiple: false,
      action: '',
      beforeUpload: (file, fileList) => this.beforeUpload(file, fileList),
      onChange(info) {
        const status = info.file.status;
        if (status !== 'uploading') {
          console.log(info.file, info.fileList);
        }
        if (status === 'done') {
          message.success(`${info.file.name} file uploaded successfully.`);
        } else if (status === 'error') {
          message.error(`${info.file.name} file upload failed.`);
        }
      },
    };
Charts组件
因为使用的Charts比较多,所以使用recharts提供的组件ResponsiveContainer为了使得这些Charts不够缩放的影响。但是当前做的这些Charts大部分都是相同的结构,所以相同的部分应该抽离出来。

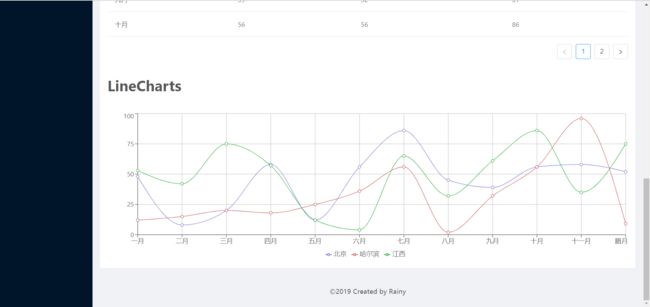
因为其他的Charts都差不多,这里我只说一下LineCharts
import React, { Component } from 'react';
import WrapperCharts from './WrapperCharts';
import './index.scss';
import {
Line,
Legend,
Tooltip,
XAxis,
YAxis,
CartesianGrid,
LineChart,
Label,
} from "recharts";
export const COLOR_LISTS = ['#8884d8', '#cf6868', '#3fb549', '#a6d41f', '#8ad4d8', '#cfdd68', '#354449', '#a75d1f'];
interface LineChartsProps {
data?: any;
names?: any;
}
export default class LineCharts extends Component {
render() {
const { data, names } = this.props;
return (
)
}
}
github page deploy
npm i -g gh-pages
package.json配置
"predeploy": "yarn run build",
"deploy": "gh-pages -d build"
部署
yarn run deploy

引入图片

以上就是这两天做的小东西,写的和讲的都很潦草,请看管轻喷。
