《机器学习实战》之logistic回归
一、Logistic回归算法
Logistic回归是一种线性拟合的分类算法,其中回归是指通过一条线对点进行拟合(该线称为最佳拟合曲线),即通过一条线使尽量多的点都在线上或离线最近(误差最小)。而logistic回归算法就是先获得所有特征的最佳拟合曲线的参数
![]()
然后再根据sigmod函数进行分类

sigmod函数是最典型的S曲线,它看起来很像一个阶跃函数,即当z>0时,sigmod(z)>0.5,且当z无限大时,sigmod(z)无限接近于1,相反则无限接近于0,故可采用sigmod函数进行分类,即当z>0时将其分为1类,小于0时分为0类,故logistic回归算法便成了求最佳拟合曲线的参数w的分类算法。
二、基于梯度上升法的拟合参数计算
梯度上升/下降和牛顿法是最常用的无约束最优参数的计算方法,此处采用其中梯度上升法。梯度上升的最基本的思想:不管是上升还是下降,如果一个函数是可微的,那么沿着它的一阶导数的方向(即梯度方向)上升和下降是最快的,如果梯度为▽,则函数f(x,y)的梯度可表示为:
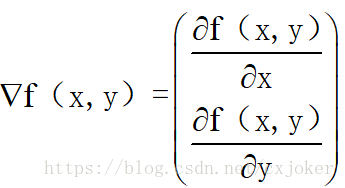
在此处求参数时,先利用最大似然估计求得似然函数,然后再利用梯度上升算法求最大似然函数得参数值,从而求得z的参数值,故在此处梯度上升算法的迭代公式为:
![]()
,其中α是迭代的步长,或者叫做学习率。
故对于logistic回归算法来说,设:
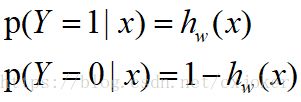
为了求最优参数w,令其代价函数为:
![]()
对其取对数似然函数有:

故当采用梯度上升算法求最优w值时,只需要求得对数似然函数的导数,即可获得梯度上升的梯度,然后就知道迭代公式。具体推导步骤见下图:

故根据图片上的推导可知,梯度上升的迭代公式为:
![]()
这就是为什么在代码函数gradAscent中采用weights = weights + alpha * dataMatrix.transpose()* error 这句代码的原因,当时想了半天,查了好久终于推导出来了。
三、代码
对于logistic回归算法来说,理解sigmod函数和理解基于梯度上升求最优化参数w之后就没什么好讲的了,其中对于随机梯度上升算法来说就是改进了原来每次遍历所有数据集而变成每次只取一个数据集进行迭代,并且迭代过的数据集以后便不再使用,其他的就没什么好说的了。然后有什么问题的话,代码都加上了注解,直接上代码吧:
# -*- coding: utf-8 -*-
"""
Created on Mon Sep 17 20:15:27 2018

@author: chenxi
"""
from matplotlib.font_manager import FontProperties
import matplotlib.pyplot as plt
import numpy as np
import random

def loadDataSet():   #加载数据函数
    dataMat = []; labelMat = []
    fr = open('testSet.txt')
    for line in fr.readlines():#直接读取全部数据作为list,然后对每个元素进行处理
        lineArr = line.strip().split()#去空格、分割
        dataMat.append([1.0, float(lineArr[0]), float(lineArr[1])])#将1.0,lineArr的第一、二个元素(转换为float类型)加入到dataMat列表
        labelMat.append(int(lineArr[2]))#获取标签
    return dataMat,labelMat

def sigmoid(inX):
    return 1.0/(1+np.exp(-inX))#inx回归系数与特征的乘积

def gradAscent(dataMatIn, classLabels):#梯度提升方法
    dataMatrix = np.mat(dataMatIn)             #将数据列表转化为矩阵np.mat
    labelMat = np.mat(classLabels).transpose() #将标签列表转化为矩阵,transpose()为转置函数
    m,n = np.shape(dataMatrix)#获取dataMatrix行数和列数,m为行数,shape(datamatrix)[0]表示获得datmat的行数,
    alpha = 0.001#步长为0.001
    maxCycles = 500#循环次数
    weights = np.ones((n,1))    #初始化系数矩阵,初始化为1,n是dataMatrix列数,即特征个数
    weights_array = np.array([])
    for k in range(maxCycles):              #
        h = sigmoid(dataMatrix*weights)     #矩阵内部的元素相乘并相加,然后输入到sigmod函数并返回值,最后形成一个列向量,每一列代表一个样本的z=w1x1+w2x2通过sigmod函数之后获得的值
        error = (labelMat - h)              #错误率代表样本标签和sigmod函数的差值,{0,1},距离越远,说明错的越大
        weights = weights + alpha * dataMatrix.transpose()* error #通  过逻辑回归的似然函数求参数最优值,采用梯度上升法最后获得的迭代公式为α*(y-h(x))x
        weights_array = np.append(weights_array,weights)
    weights_array=weights_array.reshape(maxCycles,n)
    return weights,weights_array

def plotBestFit(weights):
    import matplotlib.pyplot as plt
    dataMat,labelMat=loadDataSet()
    dataArr = np.array(dataMat)
    n = np.shape(dataArr)[0]
    xcord1 = []; ycord1 = []
    xcord2 = []; ycord2 = []
    for i in range(n):
        if int(labelMat[i])== 1:
            xcord1.append(dataArr[i,1]); ycord1.append(dataArr[i,2])#获得分类为1的横纵坐标
        else:
            xcord2.append(dataArr[i,1]); ycord2.append(dataArr[i,2])#获得分类为0的横纵坐标
    fig = plt.figure()
    ax = fig.add_subplot(111)#将画布分割成1行1列,图像画在从左到右从上到下的第1块
    #画点
    ax.scatter(xcord1, ycord1, s=30, c='red', marker='s')#分类为1的画入图中  s是大小,c为颜色
    ax.scatter(xcord2, ycord2, s=30, c='green')
    #画线
    x = np.arange(-3.0, 3.0, 0.1)   #x的坐标从-3到3,步长为0.1
    y = (-weights[0]-weights[1]*x)/weights[2]#0=w0x0+w1x1+w2x2
    y1=y.transpose()
    ax.plot(x, y1 )
    plt.xlabel('X1'); plt.ylabel('X2');
    plt.show()

def stogradacent0(datamatrix,classlebels):

    m,n=np.shape(datamatrix)
    alpha=0.01
    weights=np.ones(n)
    x=[]
    for i in range(m):
        h=sigmoid(sum(weights*datamatrix[i]))
        error=classlebels[i]-h
        weights=weights+alpha*error*datamatrix[i]
        x.append([i,weights[0],weights[1],weights[2]])
    return weights,x

def stocGradAscent1(dataMatrix, classLabels, numIter=150):
    m,n = np.shape(dataMatrix)
    weights = np.ones(n)   #初始化权重矩阵
   # weights_array=np.array([])
    for j in range(numIter):#迭代次数
        dataIndex = list(range(m))
        for i in range(m):
            alpha = 4/(1.0+j+i)+0.0001    #随着i,j的增大,步长逐渐减小,更加精细
            randIndex = int(random.uniform(0,len(dataIndex)))#每次都是随机选取样本来作为更新权重矩阵的数据,不放回抽样,因为每次抽完之后就把该数据删除
            h = sigmoid(sum(dataMatrix[randIndex]*weights))
            error = classLabels[randIndex] - h
            weights = weights + alpha * error * dataMatrix[randIndex]
           # weights_array=np.append(weights_array,weights,axis=0)
            del(dataIndex[randIndex])
    #weights_array=weights_array.reshape(numIter*m,n)
    return weights

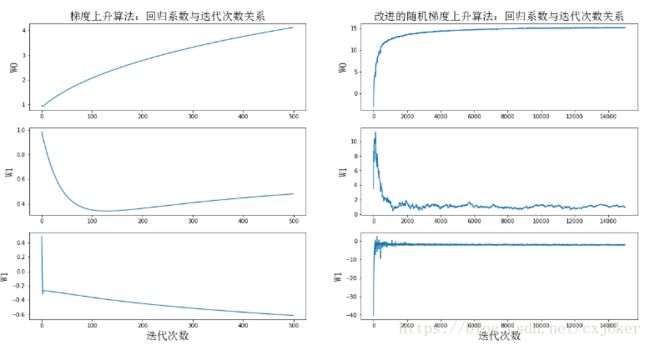
def plotWeights(weights_array1,weights_array2):
    #设置汉字格式,windows自带的汉字
    font = FontProperties(fname=r"c:\windows\fonts\simsun.ttc", size=14)
    #将fig画布分隔成1行1列,不共享x轴和y轴,fig画布的大小为(13,8)
    #当nrow=3,nclos=2时,代表fig画布被分为六个区域,axs[0][0]表示第一行第一列
    fig, axs = plt.subplots(nrows=3, ncols=2,sharex=False, sharey=False, figsize=(20,10))
    x1 = np.arange(0, len(weights_array1), 1)
    #绘制w0与迭代次数的关系
    axs[0][0].plot(x1,weights_array1[:,0])
    axs0_title_text = axs[0][0].set_title(u'梯度上升算法:回归系数与迭代次数关系',FontProperties=font)
    axs0_ylabel_text = axs[0][0].set_ylabel(u'W0',FontProperties=font)
    plt.setp(axs0_title_text, size=20, weight='bold', color='black')
    plt.setp(axs0_ylabel_text, size=20, weight='bold', color='black')
    #绘制w1与迭代次数的关系
    axs[1][0].plot(x1,weights_array1[:,1])
    axs1_ylabel_text = axs[1][0].set_ylabel(u'W1',FontProperties=font)
    plt.setp(axs1_ylabel_text, size=20, weight='bold', color='black')
    #绘制w2与迭代次数的关系
    axs[2][0].plot(x1,weights_array1[:,2])
    axs2_xlabel_text = axs[2][0].set_xlabel(u'迭代次数',FontProperties=font)
    axs2_ylabel_text = axs[2][0].set_ylabel(u'W1',FontProperties=font)
    plt.setp(axs2_xlabel_text, size=20, weight='bold', color='black')
    plt.setp(axs2_ylabel_text, size=20, weight='bold', color='black')
    x2 = np.arange(0, len(weights_array2), 1)
    #绘制w0与迭代次数的关系
    axs[0][1].plot(x2,weights_array2[:,0])
    axs0_title_text = axs[0][1].set_title(u'改进的随机梯度上升算法:回归系数与迭代次数关系',FontProperties=font)
    axs0_ylabel_text = axs[0][1].set_ylabel(u'W0',FontProperties=font)
    plt.setp(axs0_title_text, size=20, weight='bold', color='black')
    plt.setp(axs0_ylabel_text, size=20, weight='bold', color='black')
    #绘制w1与迭代次数的关系
    axs[1][1].plot(x2,weights_array2[:,1])
    axs1_ylabel_text = axs[1][1].set_ylabel(u'W1',FontProperties=font)
    plt.setp(axs1_ylabel_text, size=20, weight='bold', color='black')
    #绘制w2与迭代次数的关系
    axs[2][1].plot(x2,weights_array2[:,2])
    axs2_xlabel_text = axs[2][1].set_xlabel(u'迭代次数',FontProperties=font)
    axs2_ylabel_text = axs[2][1].set_ylabel(u'W1',FontProperties=font)
    plt.setp(axs2_xlabel_text, size=20, weight='bold', color='black')
    plt.setp(axs2_ylabel_text, size=20, weight='bold', color='black')

    plt.show()

def classifyVector(inX, weights):
    prob = sigmoid(sum(inX*weights))
    if prob > 0.5: return 1.0  #以0.5为分类线,大于0.5分类为1
    else: return 0.0

def colicTest():
    frTrain = open('horseColicTraining.txt'); frTest = open('horseColicTest.txt')
    trainingSet = []; trainingLabels = []
    for line in frTrain.readlines():
        currLine = line.strip().split('\t')
        lineArr =[]
        for i in range(21):#获取样本特征数据,转化为float数据类型
            lineArr.append(float(currLine[i]))
        trainingSet.append(lineArr)#获取样本特征数据,
        trainingLabels.append(float(currLine[21]))#获取样本标签
    trainWeights = stocGradAscent1(np.array(trainingSet), trainingLabels, 1000)#获得样本特征权值
    errorCount = 0; numTestVec = 0.0
    for line in frTest.readlines():
        numTestVec += 1.0
        currLine = line.strip().split('\t')
        lineArr =[]
        for i in range(21):
            lineArr.append(float(currLine[i]))
        if int(classifyVector(np.array(lineArr), trainWeights))!= int(currLine[21]):#计算分类错误数量
            errorCount += 1
    errorRate = (float(errorCount)/numTestVec)
    print ("the error rate of this test is: %f" % errorRate)
    return errorRate

def multiTest():
    numTests = 10; errorSum=0.0
    for k in range(numTests):
        errorSum += colicTest()
    print ("after %d iterations the average error rate is: %f" % (numTests, errorSum/float(numTests))   )


if __name__=="__main__":
    multiTest()

'''
#对比改进的梯度下降算法和未改进的梯度下降算法的回归系数与迭代次数之间的关系
if __name__=="__main__":
    dataMat,labelMat=loadDataSet()
    weights0,a0=gradAscent(np.array(dataMat),labelMat)
    weights,a=stocGradAscent1(np.array(dataMat),labelMat)
    plotWeights(a0,a)
'''
以上代码中 plotWeights函数参考了https://blog.csdn.net/c406495762/article/details/77851973这篇博客,所以在gradAscent和stogradAscent函数中会多返回一个weights_array的值。
然后测试了采用随机梯度上升和梯度上升算法对于分类正确率的影响,
这幅图是采用梯度上升算法的结果:

这幅图是采用随机梯度上升算法的结果:

可见,采用随机梯度上升算法的结果并不如采用梯度上升算法的好(迭代次数都设置为500次)所以对于小样本数据来说采用梯度上升算法效果可能比随机题都上升的更好,因为它每次都遍历了数据。
同时,遇到了一个小错误,就是每次运行都会出现这个:
![]()
查了半天不知道怎么解决,呕心。
四、画的一些图
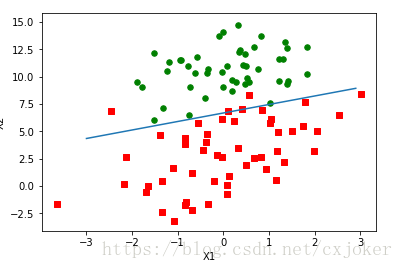
(1)采用iris数据集画的图(采用logistic回归分类器在该数据集上获得的回归系数-梯度上升算法):
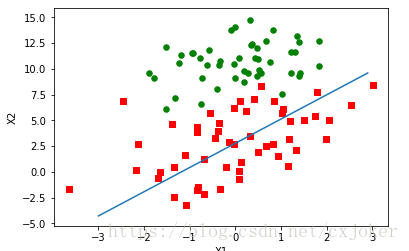
(2)改进之后的随机梯度提升算法获得的结果(随机梯度上升算法)
(3)参考博客画的梯度上升和改进的梯度上升算法之间迭代次数和收敛性关系的图,画出来的图比较丑,我也不想改了
(4)一些小问题
问题1:为什么在做iris矩阵时要在第一列加入1.0这个元素
因为回归函数w=w1x1+w2x2,第一个w相当于w*1
问题2: weights_array.append(weights,axis=0)报错’numpy.ndarray’ object has no attribute ‘append’
改成了 weights_array=np.append(weights_array,weights,axis=0)即可,所以以后都用import numpy as np坚决不用from numpy import *
五、总结
logistic属于一种线性分类算法,《机器学习实战》还加入了梯度上升和随机梯度上升进行参数求解,所以内容比较多,其实看上去的话还是比较简单的,就是理解sigmod函数,再懂得利用最大似然函数求最优值,然后再利用梯度上升求当似然函数取最优值时所采用的参数的求解方法即可。