聊聊Flame Graph(火焰图)的那些事
文章目录
- 前言
- 什么是Flame Graph
- Flame Graph的工作原理
- 附:Profile的页面快速执行构建工具
- 引用
前言
当我们很多时候在分析定位一个比较隐秘的问题时,我们马上能脱口而出好几种方法,查日志找异常,再细致一点的,jmap,jstack分析stack trace。但是一般如果到了分析stack trance的阶段时,说明这个很可能已经是performance的问题了。但其实很多时候,jstack这种默认的命令工具对于开发者来说还不够直观与好理解。它所展现的只是一堆的当前stack trance的展现,没有汇聚的阶段性的调用占比。jstack的结果还需要人工进行二次分析。因此,本文笔者来聊聊在这方面比较适用的一个工具:Flame Graph(火焰图)。
什么是Flame Graph
首先我们来了解火焰图的概念,以下是比较官方的解释:
This visualization of software execution is a new necessity for performance profiling and debugging.
以上译为:一种软件执行情况的形象化的反映,用于做性能profile和debug。
以下是flame graph的一张呈现效果图
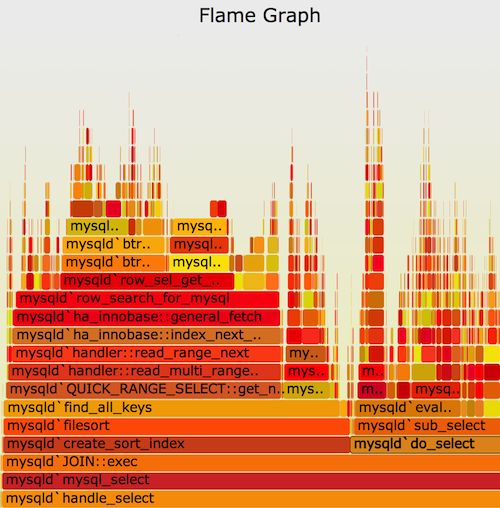
后面笔者再介绍上图的含义。
Flame Graph的工作原理
在Flame Graph在呈现出整个最终结果之前,其中主要的工作并不是图形的展现,而是前面profile数据的采集。
这里数据的采集首先按照profile的类型分为以下几类:
- CPU的profile分析,那需要进行的stack trace的采集,可以借助于Linux的perf命令
- Memory的profile,那我们需要sample一些malloc类似的系统调用。
- Off-CPU的profile,那些没有消耗CPU的线程的profile,可以理解为被block住的线程。
…
以上不同类型的profile需要依赖不同的采集工具,比较常见的还是CPU profile,对于CPU的profile,它要做的其实就是进程stack trace的收集。这个收集可以按照采集总时间,采集频率来进行。
假设我们用Linux的perf命令,对某进程id为1234的进程,进行持续60s,采集频率为每秒99次的CPU使用情况要求,命令如下:
sudo perf record -F 99 -p 1234 -g --sleep 60
上述生成的stack trace全部展现出来会相当的庞大,补过perf命令可以帮助对此进行折叠,汇总统计,然后将结果文件交由Flame Graph进行最后展示。展现效果如上小节图中所示。
上述图中,y轴高度表示的stack trace的调用深度,从上往下为从child–>parent的关系,x轴宽度表示调用的频率,所以我们在观察flame Graph的时候,要观察最顶部的那些宽度比较宽的stack信息。
Flame Graph通过图形的方式能够帮助开发者迅速定位出明显消耗资源的调用,唯一可能不足的地方在于上面每个小格子的显示空间有限,没有办法显示全操作方法名,需要再次点进去进行更一步的查看。
附:Profile的页面快速执行构建工具
最近发现有些系统代码把profile行为整合到了系统代码中,做了一个ProfileServlet,然后用户可通过页面url访问能快速得到指定进程的profile结果,相当方便,代码如下(最原始来自于Hive社区),作为和本文主题的相关内容,贴出代码,后续对大家可能有所帮助
:
/*
 * Licensed to the Apache Software Foundation (ASF) under one
 * or more contributor license agreements.  See the NOTICE file
 * distributed with this work for additional information
 * regarding copyright ownership.  The ASF licenses this file
 * to you under the Apache License, Version 2.0 (the
 * "License"); you may not use this file except in compliance
 * with the License.  You may obtain a copy of the License at
 * http://www.apache.org/licenses/LICENSE-2.0
 * Unless required by applicable law or agreed to in writing, software
 * distributed under the License is distributed on an "AS IS" BASIS,
 * WITHOUT WARRANTIES OR CONDITIONS OF ANY KIND, either express or implied.
 * See the License for the specific language governing permissions and
 * limitations under the License.
 */
package org.apache.hadoop.hdds.server;

import javax.servlet.http.HttpServlet;
import javax.servlet.http.HttpServletRequest;
import javax.servlet.http.HttpServletResponse;
import java.io.File;
import java.io.FileInputStream;
import java.io.IOException;
import java.io.InputStream;
import java.lang.management.ManagementFactory;
import java.nio.file.Files;
import java.nio.file.Path;
import java.nio.file.Paths;
import java.util.ArrayList;
import java.util.List;
import java.util.concurrent.TimeUnit;
import java.util.concurrent.atomic.AtomicInteger;
import java.util.concurrent.locks.Lock;
import java.util.concurrent.locks.ReentrantLock;

import com.google.common.base.Joiner;
import org.apache.commons.io.IOUtils;
import org.slf4j.Logger;
import org.slf4j.LoggerFactory;

/**
 * Servlet that runs async-profiler as web-endpoint.
 *
 * Source: https://github.com/apache/hive/blob/master/common/src/java/org
 * /apache/hive/http/ProfileServlet.java
 *
 * Following options from async-profiler can be specified as query paramater.
 * //  -e event          profiling event: cpu|alloc|lock|cache-misses etc.
 * //  -d duration       run profiling for  seconds (integer)
 * //  -i interval       sampling interval in nanoseconds (long)
 * //  -j jstackdepth    maximum Java stack depth (integer)
 * //  -b bufsize        frame buffer size (long)
 * //  -t                profile different threads separately
 * //  -s                simple class names instead of FQN
 * //  -o fmt[,fmt...]   output format:
 * summary|traces|flat|collapsed|svg|tree|jfr
 * //  --width px        SVG width pixels (integer)
 * //  --height px       SVG frame height pixels (integer)
 * //  --minwidth px     skip frames smaller than px (double)
 * //  --reverse         generate stack-reversed FlameGraph / Call tree
 * Example:
 * - To collect 30 second CPU profile of current process (returns FlameGraph
 * svg)
 * curl "http://localhost:10002/prof"
 * - To collect 1 minute CPU profile of current process and output in tree
 * format (html)
 * curl "http://localhost:10002/prof?output=tree&duration=60"
 * - To collect 30 second heap allocation profile of current process (returns
 * FlameGraph svg)
 * curl "http://localhost:10002/prof?event=alloc"
 * - To collect lock contention profile of current process (returns
 * FlameGraph svg)
 * curl "http://localhost:10002/prof?event=lock"
 * Following event types are supported (default is 'cpu') (NOTE: not all
 * OS'es support all events)
 * // Perf events:
 * //    cpu
 * //    page-faults
 * //    context-switches
 * //    cycles
 * //    instructions
 * //    cache-references
 * //    cache-misses
 * //    branches
 * //    branch-misses
 * //    bus-cycles
 * //    L1-dcache-load-misses
 * //    LLC-load-misses
 * //    dTLB-load-misses
 * //    mem:breakpoint
 * //    trace:tracepoint
 * // Java events:
 * //    alloc
 * //    lock
 */
public class ProfileServlet extends HttpServlet {
  private static final long serialVersionUID = 1L;
  private static final Logger LOG =
      LoggerFactory.getLogger(ProfileServlet.class);
  private static final String ACCESS_CONTROL_ALLOW_METHODS =
      "Access-Control-Allow-Methods";
  private static final String ALLOWED_METHODS = "GET";
  private static final String ACCESS_CONTROL_ALLOW_ORIGIN =
      "Access-Control-Allow-Origin";
  private static final String CONTENT_TYPE_TEXT = "text/plain; charset=utf-8";
  private static final String ASYNC_PROFILER_HOME_ENV = "ASYNC_PROFILER_HOME";
  private static final String ASYNC_PROFILER_HOME_SYSTEM_PROPERTY =
      "async.profiler.home";
  private static final String PROFILER_SCRIPT = "/profiler.sh";
  private static final int DEFAULT_DURATION_SECONDS = 10;
  private static final AtomicInteger ID_GEN = new AtomicInteger(0);
  static final Path OUTPUT_DIR =
      Paths.get(System.getProperty("java.io.tmpdir"), "prof-output");

  private Lock profilerLock = new ReentrantLock();
  private Integer pid;
  private String asyncProfilerHome;
  private transient Process process;

  public ProfileServlet() {
    this.asyncProfilerHome = getAsyncProfilerHome();
    this.pid = getPid();
    LOG.info("Servlet process PID: {} asyncProfilerHome: {}", pid,
        asyncProfilerHome);
    try {
      Files.createDirectories(OUTPUT_DIR);
    } catch (IOException e) {
      LOG.error(
          "Can't create the output directory for java profiler: " + OUTPUT_DIR,
          e);
    }
  }

  private Integer getPid() {
    // JVM_PID is exported by bin/ozone
    String pidStr = System.getenv("JVM_PID");

    // in case if it is not set correctly used fallback from mxbean which is
    // implementation specific
    if (pidStr == null || pidStr.trim().isEmpty()) {
      String name = ManagementFactory.getRuntimeMXBean().getName();
      if (name != null) {
        int idx = name.indexOf("@");
        if (idx != -1) {
          pidStr = name.substring(0, name.indexOf("@"));
        }
      }
    }
    try {
      if (pidStr != null) {
        return Integer.valueOf(pidStr);
      }
    } catch (NumberFormatException nfe) {
      // ignore
    }
    return null;
  }

  public Process runCmdAsync(List<String> cmd) {
    try {
      LOG.info("Running command async: " + cmd);
      return new ProcessBuilder(cmd).inheritIO().start();
    } catch (IOException ex) {
      throw new IllegalStateException(ex);
    }
  }

  @Override
  protected void doGet(final HttpServletRequest req,
      final HttpServletResponse resp) throws IOException {
    // make sure async profiler home is set
    if (asyncProfilerHome == null || asyncProfilerHome.trim().isEmpty()) {
      resp.setStatus(HttpServletResponse.SC_INTERNAL_SERVER_ERROR);
      setResponseHeader(resp);
      resp.getWriter().write("ASYNC_PROFILER_HOME env is not set.");
      return;
    }

    //download the finished file
    if (req.getParameter("file") != null) {
      doGetDownload(req.getParameter("file"), req, resp);
      return;
    }
    // if pid is explicitly specified, use it else default to current process
    pid = getInteger(req, "pid", pid);

    // if pid is not specified in query param and if current process pid
    // cannot be determined
    if (pid == null) {
      resp.setStatus(HttpServletResponse.SC_INTERNAL_SERVER_ERROR);
      setResponseHeader(resp);
      resp.getWriter().write(
          "'pid' query parameter unspecified or unable to determine PID of "
              + "current process.");
      return;
    }

    final int duration = getInteger(req, "duration", DEFAULT_DURATION_SECONDS);
    final Output output = getOutput(req);
    final Event event = getEvent(req);
    final Long interval = getLong(req, "interval");
    final Integer jstackDepth = getInteger(req, "jstackdepth", null);
    final Long bufsize = getLong(req, "bufsize");
    final boolean thread = req.getParameterMap().containsKey("thread");
    final boolean simple = req.getParameterMap().containsKey("simple");
    final Integer width = getInteger(req, "width", null);
    final Integer height = getInteger(req, "height", null);
    final Double minwidth = getMinWidth(req);
    final boolean reverse = req.getParameterMap().containsKey("reverse");

    if (process == null || !process.isAlive()) {
      try {
        int lockTimeoutSecs = 3;
        if (profilerLock.tryLock(lockTimeoutSecs, TimeUnit.SECONDS)) {
          try {
            File outputFile =
                OUTPUT_DIR.resolve("async-prof-pid-" + pid + "-" +
                    event.name().toLowerCase() + "-" + ID_GEN.incrementAndGet()
                    + "." +
                    output.name().toLowerCase()).toFile();
            List<String> cmd = new ArrayList<>();
            cmd.add(asyncProfilerHome + PROFILER_SCRIPT);
            cmd.add("-e");
            cmd.add(event.getInternalName());
            cmd.add("-d");
            cmd.add("" + duration);
            cmd.add("-o");
            cmd.add(output.name().toLowerCase());
            cmd.add("-f");
            cmd.add(outputFile.getAbsolutePath());
            if (interval != null) {
              cmd.add("-i");
              cmd.add(interval.toString());
            }
            if (jstackDepth != null) {
              cmd.add("-j");
              cmd.add(jstackDepth.toString());
            }
            if (bufsize != null) {
              cmd.add("-b");
              cmd.add(bufsize.toString());
            }
            if (thread) {
              cmd.add("-t");
            }
            if (simple) {
              cmd.add("-s");
            }
            if (width != null) {
              cmd.add("--width");
              cmd.add(width.toString());
            }
            if (height != null) {
              cmd.add("--height");
              cmd.add(height.toString());
            }
            if (minwidth != null) {
              cmd.add("--minwidth");
              cmd.add(minwidth.toString());
            }
            if (reverse) {
              cmd.add("--reverse");
            }
            cmd.add(pid.toString());
            process = runCmdAsync(cmd);

            // set response and set refresh header to output location
            setResponseHeader(resp);
            resp.setStatus(HttpServletResponse.SC_ACCEPTED);
            String relativeUrl = "/prof?file=" + outputFile.getName();
            resp.getWriter().write(
                "Started [" + event.getInternalName()
                    + "] profiling. This page will automatically redirect to " +
                    relativeUrl + " after " + duration
                    + " seconds.\n\ncommand:\n" + Joiner.on(" ").join(cmd));
            resp.getWriter().write(
                "\n\n\nPlease make sure that you enabled the profiling on "
                    + "kernel level:\n"
                    + "echo 1 > /proc/sys/kernel/perf_event_paranoid\n"
                    + "echo 0 > /proc/sys/kernel/kptr_restrict\n\n"
                    + "See https://github"
                    + ".com/jvm-profiling-tools/async-profiler#basic-usage"
                    + " for more details.");
            // to avoid auto-refresh by ProfileOutputServlet, refreshDelay
            // can be specified via url param
            int refreshDelay = getInteger(req, "refreshDelay", 0);

            // instead of sending redirect, set auto-refresh so that browsers
            // will refresh with redirected url
            resp.setHeader("Refresh",
                (duration + refreshDelay) + ";" + relativeUrl);
            resp.getWriter().flush();
          } finally {
            profilerLock.unlock();
          }
        } else {
          setResponseHeader(resp);
          resp.setStatus(HttpServletResponse.SC_INTERNAL_SERVER_ERROR);
          resp.getWriter().write(
              "Unable to acquire lock. Another instance of profiler might be "
                  + "running.");
          LOG.warn(
              "Unable to acquire lock in {} seconds. Another instance of "
                  + "profiler might be running.",
              lockTimeoutSecs);
        }
      } catch (InterruptedException e) {
        LOG.warn("Interrupted while acquiring profile lock.", e);
        resp.setStatus(HttpServletResponse.SC_INTERNAL_SERVER_ERROR);
      }
    } else {
      setResponseHeader(resp);
      resp.setStatus(HttpServletResponse.SC_INTERNAL_SERVER_ERROR);
      resp.getWriter()
          .write("Another instance of profiler is already running.");
    }
  }

  protected void doGetDownload(String fileName, final HttpServletRequest req,
      final HttpServletResponse resp)
      throws IOException {

    File requestedFile =
        ProfileServlet.OUTPUT_DIR.resolve(fileName).toAbsolutePath()
            .toFile();
    // async-profiler version 1.4 writes 'Started [cpu] profiling' to output
    // file when profiler is running which
    // gets replaced by final output. If final output is not ready yet, the
    // file size will be <100 bytes (in all modes).
    if (requestedFile.length() < 100) {
      LOG.info("{} is incomplete. Sending auto-refresh header..",
          requestedFile);
      resp.setHeader("Refresh",
          "2," + req.getRequestURI() + "?file=" + fileName);
      resp.getWriter().write(
          "This page will auto-refresh every 2 second until output file is "
              + "ready..");
    } else {
      if (fileName.endsWith(".svg")) {
        resp.setContentType("image/svg+xml");
      } else if (fileName.endsWith(".tree")) {
        resp.setContentType("text/html");
      }
      try (InputStream input = new FileInputStream(requestedFile)) {
        IOUtils.copy(input, resp.getOutputStream());
      }
    }
  }

  private Integer getInteger(final HttpServletRequest req, final String param,
      final Integer defaultValue) {
    final String value = req.getParameter(param);
    if (value != null) {
      try {
        return Integer.valueOf(value);
      } catch (NumberFormatException e) {
        return defaultValue;
      }
    }
    return defaultValue;
  }

  private Long getLong(final HttpServletRequest req, final String param) {
    final String value = req.getParameter(param);
    if (value != null) {
      try {
        return Long.valueOf(value);
      } catch (NumberFormatException e) {
        return null;
      }
    }
    return null;
  }

  private Double getMinWidth(final HttpServletRequest req) {
    final String value = req.getParameter("minwidth");
    if (value != null) {
      try {
        return Double.valueOf(value);
      } catch (NumberFormatException e) {
        return null;
      }
    }
    return null;
  }

  private Event getEvent(final HttpServletRequest req) {
    final String eventArg = req.getParameter("event");
    if (eventArg != null) {
      Event event = Event.fromInternalName(eventArg);
      return event == null ? Event.CPU : event;
    }
    return Event.CPU;
  }

  private Output getOutput(final HttpServletRequest req) {
    final String outputArg = req.getParameter("output");
    if (req.getParameter("output") != null) {
      try {
        return Output.valueOf(outputArg.trim().toUpperCase());
      } catch (IllegalArgumentException e) {
        return Output.SVG;
      }
    }
    return Output.SVG;
  }

  private void setResponseHeader(final HttpServletResponse response) {
    response.setHeader(ACCESS_CONTROL_ALLOW_METHODS, ALLOWED_METHODS);
    response.setHeader(ACCESS_CONTROL_ALLOW_ORIGIN, "*");
    response.setContentType(CONTENT_TYPE_TEXT);
  }

  static String getAsyncProfilerHome() {
    String asyncProfilerHome = System.getenv(ASYNC_PROFILER_HOME_ENV);
    // if ENV is not set, see if -Dasync.profiler
    // .home=/path/to/async/profiler/home is set
    if (asyncProfilerHome == null || asyncProfilerHome.trim().isEmpty()) {
      asyncProfilerHome =
          System.getProperty(ASYNC_PROFILER_HOME_SYSTEM_PROPERTY);
    }

    return asyncProfilerHome;
  }

  enum Event {
    CPU("cpu"),
    ALLOC("alloc"),
    LOCK("lock"),
    PAGE_FAULTS("page-faults"),
    CONTEXT_SWITCHES("context-switches"),
    CYCLES("cycles"),
    INSTRUCTIONS("instructions"),
    CACHE_REFERENCES("cache-references"),
    CACHE_MISSES("cache-misses"),
    BRANCHES("branches"),
    BRANCH_MISSES("branch-misses"),
    BUS_CYCLES("bus-cycles"),
    L1_DCACHE_LOAD_MISSES("L1-dcache-load-misses"),
    LLC_LOAD_MISSES("LLC-load-misses"),
    DTLB_LOAD_MISSES("dTLB-load-misses"),
    MEM_BREAKPOINT("mem:breakpoint"),
    TRACE_TRACEPOINT("trace:tracepoint");

    private String internalName;

    Event(final String internalName) {
      this.internalName = internalName;
    }

    public String getInternalName() {
      return internalName;
    }

    public static Event fromInternalName(final String name) {
      for (Event event : values()) {
        if (event.getInternalName().equalsIgnoreCase(name)) {
          return event;
        }
      }

      return null;
    }
  }

  enum Output {
    SUMMARY,
    TRACES,
    FLAT,
    COLLAPSED,
    SVG,
    TREE,
    JFR
  }

}
引用
[1].https://queue.acm.org/detail.cfm?id=2927301
[2].http://www.brendangregg.com/flamegraphs.html