(八)Python 中的 AdaBoost 分类器实例
作者:chen_h
微信号 & QQ:862251340
微信公众号:coderpai
(一)机器学习中的集成学习入门
(二)bagging 方法
(三)使用Python进行交易的随机森林算法
(四)Python中随机森林的实现与解释
(五)如何用 Python 从头开始实现 Bagging 算法
(六)如何利用Python从头开始实现随机森林算法
(七)AdaBoost 简介
(八)Python 中的 AdaBoost 分类器实例
boosting 算法背后的思路是按照顺序训练预测模型,每个模型都试图去纠正前面的错误。两种最常见的模型就是AdaBoost 和 Gradient Boosting。在上一篇文章中,我们已经介绍了 AdaBoost 。从较高的层面上看,AdaBoost 类似于随机森林,因为它们都统计了森林中每个决策树所做的预测,从而来决定最终的分类。但是,它们之间肯定有一些微妙的差异。例如,在 AdaBoost 中,决策树的深度为 1。此外,每个决策树做出的预测对模型的最终预测产生不同的影响。
算法
在前面的实例中,我们将使用一个数据集,给定一些人的特征,来判断这个人是不是受欢迎。
| weight | smart | polite | fit | attractive |
|---|---|---|---|---|
| 180 | no | no | no | no |
| 150 | yes | Yes | no | no |
| 175 | yes | Yes | yes | yes |
| 165 | Yes | yes | yes | yes |
| 190 | no | yes | No | no |
| 201 | yes | yes | yes | yes |
| 185 | yes | yes | no | yes |
| 168 | Yes | No | Yes | yes |
Step 1:初始化样本权重
在 AdaBoost 的第一步中,每个样本都与一个权重相关联,该权重表明它在分类方面的重要性。最初,所有样本具有想听的权重。(1除以样本总数, 1 / N 1/N 1/N)
| weight | smart | polite | fit | attractive | Sample weight |
|---|---|---|---|---|---|
| 180 | no | no | no | no | 1/8 |
| 150 | yes | Yes | no | no | 1/8 |
| 175 | yes | Yes | yes | yes | 1/8 |
| 165 | Yes | yes | yes | yes | 1/8 |
| 190 | no | yes | No | no | 1/8 |
| 201 | yes | yes | yes | yes | 1/8 |
| 185 | yes | yes | no | yes | 1/8 |
| 168 | Yes | No | Yes | yes | 1/8 |
Step 2:使用每个特征去构建决策树,对数据进行分类并评估结果
接下来,对于每个特征,我们构建一个深度为 1 的决策树。然后,我们使用每个决策树对数据进行分类。然后,我们将每棵树的预测与训练集中的实际标签进行比较。我们对训练样本中得到最好的结果的特征和树模型使其成为森林中的下一课树。
例如,假设我们建造了一棵树,如果人 smart = yes,那么我们就认为这个人具有吸引力。如果人 smart = no,那么我们就认为这个人没有吸引力。
根据他们是否 smart 进行分类,决策树错误的将一个人计算错误了。将一个 smart = yes 的人归纳为吸引,但真实情况是不吸引。
Step 3:计算最终分类中树的重要性
一旦我们决定了决策树。我们使用前面的公式来计算它在最终分类中的权重
s i g n i f i c a n c e = 1 2 l o g ( 1 − t o t a l e r r o r t o t a l e r r o r ) significance = \frac{1}{2}log(\frac{1-totalerror}{totalerror}) significance=21log(totalerror1−totalerror)
totalerror 是错误分类的样本的权重之和。回到我们的例子,total error 应该等于如下:
t o t a l e r r o r = s u m o f w e i g h t s f o r i n c o r r e c t l y c l a s s i f i e d s a m p l e s = 1 8 ∗ 1 = 1 8 total error = sum of weights for incorrectly classified samples= \frac{1}{8} * 1 = \frac{1}{8} totalerror=sumofweightsforincorrectlyclassifiedsamples=81∗1=81
我们将 totalerror 参数插入到我们的公式中,我们得到:
s i g n i f i c a n c e = 1 2 l o g ( 1 − 1 8 1 8 ) = 0.97 significance = \frac{1}{2} log(\frac{1-\frac{1}{8}}{\frac{1}{8}}) = 0.97 significance=21log(811−81)=0.97
正如我们稍后将看到的,这个数字用于后续的权重更新。
Step 4:更新样本权重,以便下一个决策树将上一个决策树所产生的错误考虑在内
我们查看当前树分类不正确的样本,并使用以下公式增加其相关权重。
n e w s a m p l e w e i g h t = s a m p l e w e i g h t ∗ e x p ( s i g n i f i c a n c e ) newsampleweight=sampleweight * exp(significance) newsampleweight=sampleweight∗exp(significance)
这里没有什么花哨的东西,我们使用 e 来提高权重,是因为我们希望新的样本权重呈现指数增长。
n e w s a m p l e w e i g h t = 1 8 ∗ e x p ( 0.97 ) = 1 8 ∗ 2.64 = 0.33 newsampleweight=\frac{1}{8} * exp(0.97) = \frac{1}{8} * 2.64 = 0.33 newsampleweight=81∗exp(0.97)=81∗2.64=0.33
然后,我们使用以下公式查看树正确分类的样本,并且降低其相关权重。
n e w s a m p l e w e i g h t = s a m p l e w e i g h t ∗ e x p ( − s i g n i f i c a n c e ) newsampleweight=sampleweight * exp(- significance) newsampleweight=sampleweight∗exp(−significance)
该方程跟此前的方程式相同,我们只是将 e 提高到负指数。
n e w s a m p l e w e i g h t = 1 8 ∗ e x p ( − 0.97 ) = 1 8 ∗ 0.38 = 0.05 newsampleweight=\frac{1}{8} * exp(-0.97) = \frac{1}{8} * 0.38 = 0.05 newsampleweight=81∗exp(−0.97)=81∗0.38=0.05
这里的主要内容是,前一个树桩错误分类的样本应该与较大的样本权重相关联,并且正确分类的样本应该与较小的样本权重相关联。
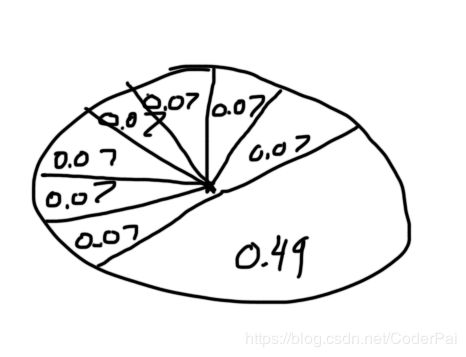
注意,如果我们将所有样本权重加起来,我们得到的是一个小于 1 的数字。因此,我们将新样本权重标准化,使得他们加起来为 1 。
| weight | smart | polite | fit | attractive | Sample weight | new weight | normalized weight |
|---|---|---|---|---|---|---|---|
| 180 | no | no | no | no | 1/8 | 0.05 | 0.07 |
| 150 | yes | Yes | no | no | 1/8 | 0.33 | 0.49 |
| 175 | yes | Yes | yes | yes | 1/8 | 0.05 | 0.07 |
| 165 | Yes | yes | yes | yes | 1/8 | 0.05 | 0.07 |
| 190 | no | yes | No | no | 1/8 | 0.05 | 0.07 |
| 201 | yes | yes | yes | yes | 1/8 | 0.05 | 0.07 |
| 185 | yes | yes | no | yes | 1/8 | 0.05 | 0.07 |
| 168 | Yes | No | Yes | yes | 1/8 | 0.05 | 0.07 |
Step 5:形成一个新的数据集
我们首先创建的一个与原始数据集大小相同的新数据集。然后,想象一下轮盘赌桌,其中每个口袋对应一个样本权重。我们随机选择 0 到 1 之间的数字。每个数字落在的位置决定了我们在新的数据集中放置的样本。
由于错误分类的样本相对于其他样本具有更高的权重,因此随机数落在其分布的切片下的可能性更大。因此,新数据集将倾向于包含由前一树错误分类的样本的多个副本。因此,当我们回到评估每个决策树所做预测的步骤时,得分最高的那个将正确的分类前一个树被错误分类的样本。
Step 6:重复步骤 2 到 5,直到迭代次数等于超参数指定的数量(即估计量的数量)
Step 7:使用决策树林来预测训练集之外的数据
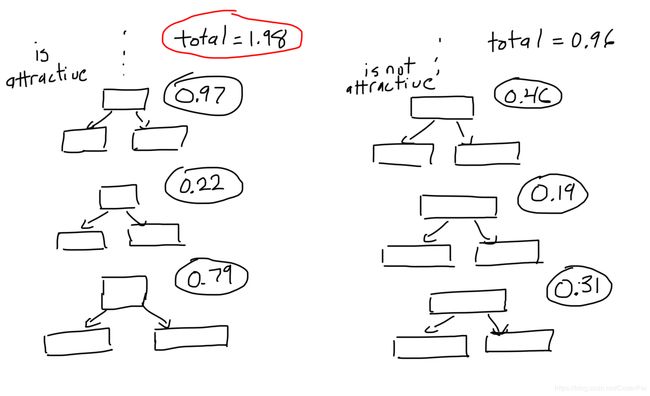
AdaBoost 模型通过让森林中的每棵树对样本进行分类来进行预测。然后,我们根据它们的决定将树分成几组。对于每个组,我们将组内每棵树的重要性加起来。森林作为一个整体进行的最终分类由综合最大的群体决定。
代码
让我们看看如何在 Python 中实现 AdaBoost 。首先,我们导入以下库。
from sklearn.ensemble import AdaBoostClassifier
from sklearn.tree import DecisionTreeClassifier
from sklearn.datasets import load_breast_cancer
import pandas as pd
import numpy as np
from sklearn.model_selection import train_test_split
from sklearn.metrics import confusion_matrix
from sklearn.preprocessing import LabelEncoder
在这个例子中,我们将使用 AdaBoost 将肿瘤归类为恶性或者良性肿瘤。我们使用 scikit-learn API 将数据集导入到我们的程序中。
breast_cancer = load_breast_cancer()
X = pd.DataFrame(breast_cancer.data, columns=breast_cancer.feature_names)
y = pd.Categorical.from_codes(breast_cancer.target, breast_cancer.target_names)
每当我们使用分类功能时,我们必须将其编码为数字。对于这个问题,我们将恶性设置为 1 ,并将良性设置为 0 。
encoder = LabelEncoder()
binary_encoded_y = pd.Series(encoder.fit_transform(y))
我们将数据分为训练集和测试集,来评估我们的模型。
train_X, test_X, train_y, test_y = train_test_split(X, binary_encoded_y, random_state=1)
接下来,我们构建并将我们的模型拟合到训练集。max_depth = 1 用于告诉我们的模型我们希望我们的森林中单颗树的只有一个节点。n_estimators 用于制定树林中树的总数。
classifier = AdaBoostClassifier(
    DecisionTreeClassifier(max_depth=1),
    n_estimators=200
)
classifier.fit(train_X, train_y)
我们使用我们的模型来预测肿瘤是否恶性的或者良性的。
predictions = classifier.predict(test_X)
最后,我们使用混淆矩阵评估模型。该模型产生了 2 个误报和 3 个假阴性。
confusion_matrix(test_y, predictions)
输出结果为:
[[86, 2], [3, 52]]
最后
与随机森林一样,AdaBoost 通过对每个样本应用多个决策树并组合各个树的预测来进行预测。然而,在 AdaBoost 算法中,不是采用森林中每个决策树所作出的预测的平均值,而是每个决策树对最终预测贡献的不同的量


