numpy数组拼接:stack(),vstack(),hstack()函数使用总结
numpy数组拼接:stack(),vstack(),hstack()函数使用总结
在学习中遇到了上面这三个函数,容易混淆,特在此做个总结,为了便于理解对数据做了一些简单的可视化处理。以下代码在jupyter上实现。
import numpy as np
import matplotlib.pyplot as plt
%matplotlib inline
a = np.arange(0,15)
b = 2*a
c = np.stack((a,b))
d = np.vstack((a,b))
e = np.hstack((a,b))
print(c)
print(d)
print(e)
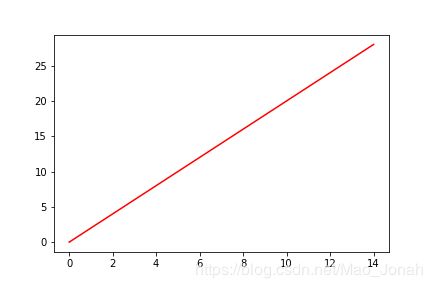
plt.plot(c[0],c[1],color='red')
plt.savefig('stack.png')
输出:
[[ 0  1  2  3  4  5  6  7  8  9 10 11 12 13 14]
 [ 0  2  4  6  8 10 12 14 16 18 20 22 24 26 28]]
[[ 0  1  2  3  4  5  6  7  8  9 10 11 12 13 14]
 [ 0  2  4  6  8 10 12 14 16 18 20 22 24 26 28]]
[ 0  1  2  3  4  5  6  7  8  9 10 11 12 13 14  0  2  4  6  8 10 12 14 16
 18 20 22 24 26 28]
1. numpy.vstack(tup)
从上面的代码及输出结果我们可以得知numpy.vstack()函数是将数组垂直堆叠起来,这个函数与numpy.stack()在参数axis=0时很像。
2. numpy.hstack(tup)
同样,我们容易得知numpy.hstack()函数是将数组沿水平方向堆叠起来。
3. numpty.stack(arrays, axis=0, out=None)
使用numpy.stack()函数会增加一个维度,
c1 = np.stack((a,b),axis=1)
print(c1.shape)
print(c1)
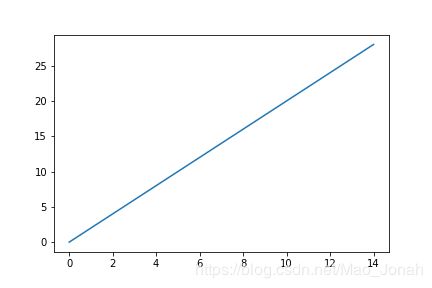
plt.plot(c1[:,0],c1[:,1])
plt.savefig('stack_axis=1.png')
输出:
(15, 2)
[[ 0  0]
 [ 1  2]
 [ 2  4]
 [ 3  6]
 [ 4  8]
 [ 5 10]
 [ 6 12]
 [ 7 14]
 [ 8 16]
 [ 9 18]
 [10 20]
 [11 22]
 [12 24]
 [13 26]
 [14 28]]
a,b是两个一维数组,numpy.stack()函数的难点在于参数axis的选择,参数默认axis=0。当参数axis=0时跟numpy.vstack()类似。
x = np.random.randn(2,3)
print(x)
print('*********************************************')
x = [x for _ in range(4)]
z = np.stack(x)
print(z.shape)
print(z)
print('*********************************************')
z = np.stack(x,axis=1)
print(z.shape)
print(z)
print('*********************************************')
z = np.stack(x,axis=2)
print(z.shape)
print(z)
Output:
[[ 0.5456976  -0.39267711 -0.19219264]
 [ 0.33489732 -0.76980012  0.35207285]]
*********************************************
(4, 2, 3)
[[[ 0.5456976  -0.39267711 -0.19219264]
  [ 0.33489732 -0.76980012  0.35207285]]

 [[ 0.5456976  -0.39267711 -0.19219264]
  [ 0.33489732 -0.76980012  0.35207285]]

 [[ 0.5456976  -0.39267711 -0.19219264]
  [ 0.33489732 -0.76980012  0.35207285]]

 [[ 0.5456976  -0.39267711 -0.19219264]
  [ 0.33489732 -0.76980012  0.35207285]]]
*********************************************
(2, 4, 3)
[[[ 0.5456976  -0.39267711 -0.19219264]
  [ 0.5456976  -0.39267711 -0.19219264]
  [ 0.5456976  -0.39267711 -0.19219264]
  [ 0.5456976  -0.39267711 -0.19219264]]

 [[ 0.33489732 -0.76980012  0.35207285]
  [ 0.33489732 -0.76980012  0.35207285]
  [ 0.33489732 -0.76980012  0.35207285]
  [ 0.33489732 -0.76980012  0.35207285]]]
*********************************************
(2, 3, 4)
[[[ 0.5456976   0.5456976   0.5456976   0.5456976 ]
  [-0.39267711 -0.39267711 -0.39267711 -0.39267711]
  [-0.19219264 -0.19219264 -0.19219264 -0.19219264]]

 [[ 0.33489732  0.33489732  0.33489732  0.33489732]
  [-0.76980012 -0.76980012 -0.76980012 -0.76980012]
  [ 0.35207285  0.35207285  0.35207285  0.35207285]]]
在上面的代码中,输出了不同axis数值下的shape:(4,2,3),(2,4,3),(2,3,4)从中我们可以看到,参数axis等于几增加的那个维度就在第几个维度上。
img = np.zeros((720, 1280, 3), np.uint8)
y = np.linspace(0,719,720)
x1 = np.full((720,),360)
x2 = np.full((720,),940)
ptsl = np.transpose(np.vstack((x1,y)))
ptsr = np.transpose(np.vstack((x2,y)))[::-1]
pts = np.vstack((ptsl,ptsr))

cv2.fillPoly(img, np.int_([pts]), (0, 255,0))

plt.imshow(img)
plt.show()
