机器学习入门第四篇——Octave/Matlab Tutorial(4)
机器学习入门第四篇——Octave/Matlab Tutorial(4)
- Compution on Data
- Ploting Data
Compution on Data
A=magic(3) % 魔方阵,它们所有的行和列和对角线加起来都等于相同的值
% The magic function returns these matrices called magic squares mathematical property that
% all their row and columns and diagonals sum up to the same thing.
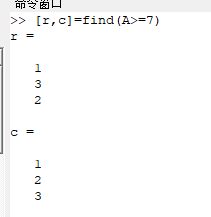
[r,c]=find(A>=7) % 找元素大于等于7的行和列
sum(a) % 求和
prod(a) % 求积
ceil(a)  % 向上四舍五入
floor(a) % 向下四舍五入

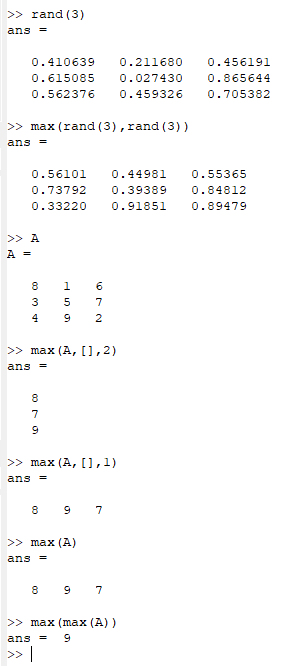
rand(3) % 随机函数,产生了一个3*3的随机矩阵
max(rand(3),rand(3)) % 在产生的3*3的随机矩阵中找到最大的,再组成一个3*3的矩阵
max(A,[],2) % takes the per row maximum
max(A,[],1) % takes the column wise maxmum
max(A) % takes the column wise maxmum
max(max(A)) % A中最大值
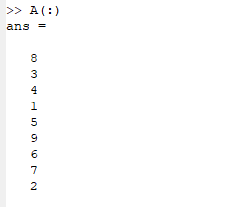
A(:) % turn A into a vector
A=magic(9)
sum(A ,1)
sum(A ,2)
sum(sum(A .* eye(9))) % 对角线元素之和
sum(sum(A.*flipud(eye(9)))) % flipud stand for flip up down 斜对角线元素之和

![]()
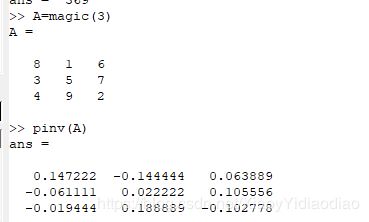
A=magic(3)
pinv(A) % pseudo - inverse 逆矩阵
Ploting Data
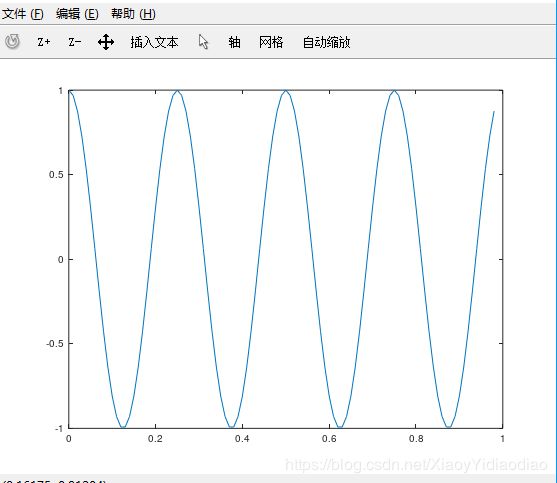
t=[0:0.01:0.98]; % 步长为0.01的0-0.98长度

y=sin(2*pi*4*t);
plot(t,y) % 画sin函数

y2=cos(2*pi*4*t);
plot(t,y2) % 画cos函数
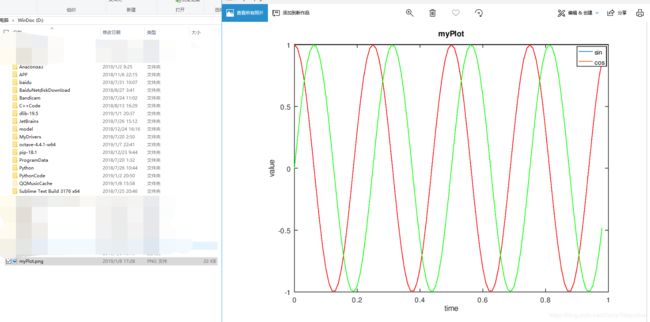
plot(t,y2,'r'); % ' r ' 表示红色 red,cos函数画红色
hold on; %开着cos函数的图
plot(t,y,'g'); % ' g ' 表示绿色 green,sin函数画绿色
xlabel('time') % 给x贴上time的标签
ylabel('value') % 给y贴上value的标签
legend('sin','cos') % 标记两个函数

 title('myPlot') % 题目
cd 'D:';print -dpng 'myPlot.png' % 保存图片到D盘
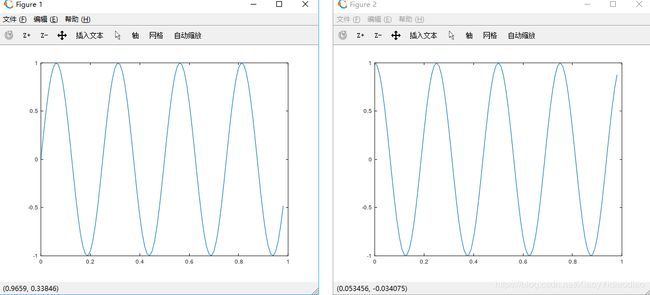
 figure(2);plot(t,y2);
 figure(1);plot(t,y);
 % 两张图片同时打开
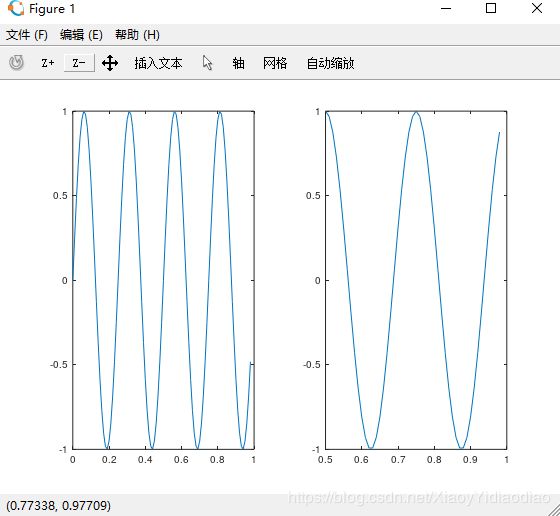
subplot(1,2,1) % Divides plot grid, access first element.
plot(t,y);
subplot(1,2,2); % Divides plot grid, access second element.
plot(t,y2); % 将sin和cos放在同一张图片中,但是是两个不同的坐标
axis([0.5 1 -1 1]) % 更改坐标
clf; % 清除图像