算法、Python——寻路算法(最小代价路径、最短时间路径)
背景
如何花费最短的时间到达目的地?
如何在一个不规则的迷宫中找到出路?
如何在一片起伏不平的地形中找出出发点到目的点的最佳路径?
我们以一个二维数组来储存地形信息,数值越大的代表穿越该点需要的代价(时间、花费)越高,图中对应单元格也越亮。圆点为出发点、菱形点为目的点,下图绘制了 ( 0 , 0 ) (0,0) (0,0)到 ( 49 , 0 ) , ( 99 , 0 ) , ( 0 , 49 ) , ( 49 , 49 ) ( 49 , 99 ) (49,0),(99,0),(0,49),(49,49)(49,99) (49,0),(99,0),(0,49),(49,49)(49,99)的最小代价路径(起点到终点的所有路径中穿越点代价之和最小的路径)。
算法效果
1.金字塔
图中心为金字塔亮斑,在底噪由小到大的情况下,绕过塔和上塔的最小代价路径:

2.迷宫
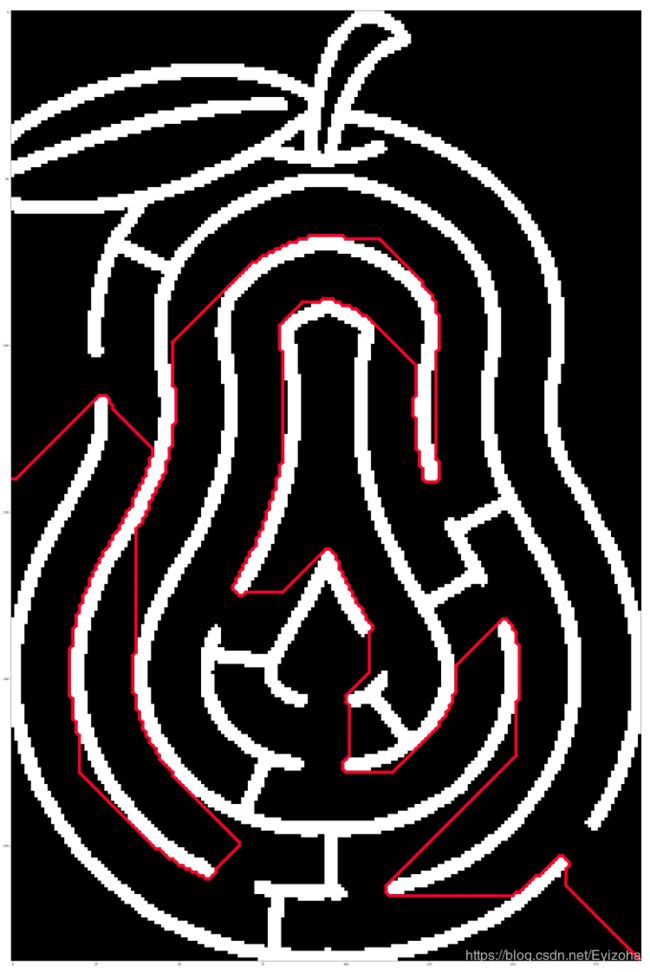
下图为同一迷宫(墙壁值=255)在底噪由小到大(0,10,30)的情况下的最小代价路径:

可以发现底噪过大时,最佳路径可能会穿墙而过,因为穿墙只要255比绕路划算。
下图为不规则迷宫效果:

3.全路径
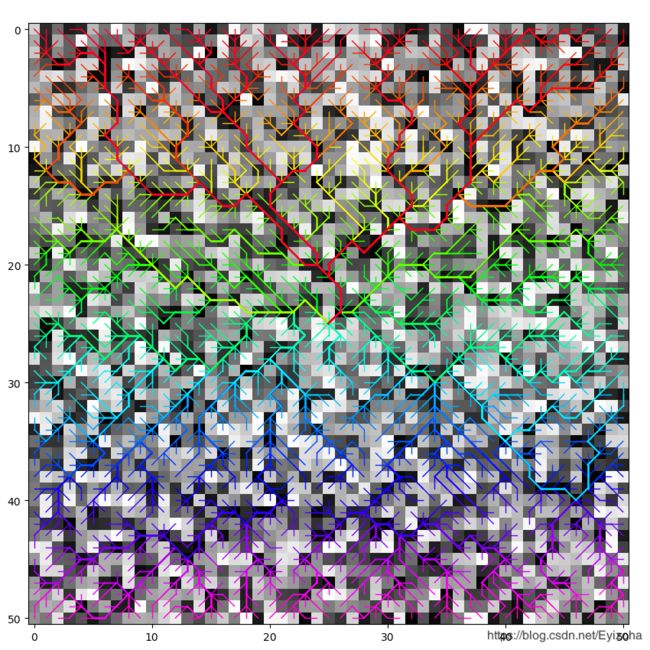
将图中某一起点到所有其他点之间的最小代价路径全部绘出称为全路径图,下图是以 ( 25 , 25 ) (25,25) (25,25)为起点的 , 50 × 50 ,50×50 ,50×50全路径随机图:

以下分别是以 ( 0 , 0 ) (0,0) (0,0)和 ( 51 , 51 ) (51,51) (51,51)为起点的同一幅 101 × 101 101×101 101×101全路径随机图:

4.亮点以及全路径
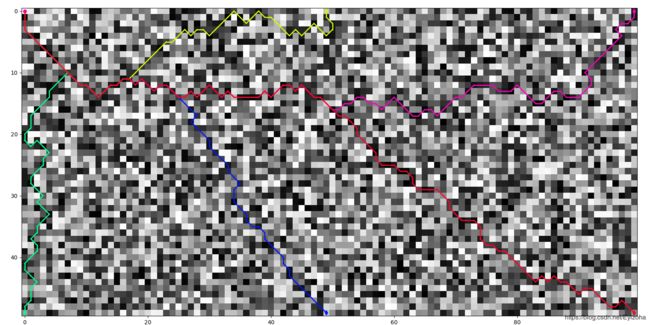
一幅 101 × 101 101×101 101×101的四亮点图以 ( 0 , 0 ) (0,0) (0,0)和 ( 60 , 50 ) (60,50) (60,50)为起点时的全路径图:

算法&代码
1.算法
为了得到最小代价的路径,我们采用代价扩散的方法:初始化一个充满 + ∞ +\infin +∞的代价图,维护一个更新点队列,从起点开始将代价累计并层层向外扩散,不断更新代价图并生成回溯图,更新原则为当前代价小于原代价,最终无点需要更新则完成代价扩散。根据回溯图便可以得到任一点回溯到起点的最小代价路径。
2.代码
# 亮点绘制(地形图,坐标,半径,亮度,衰减方式)
def pointmaker(topography, coord, radius, luminance=255, decline=None):
    if decline is None:
        def decline(x):
            coef = radius**2 / np.log(luminance)
            return np.exp(-(x**2)/coef)
    for i in range(topography.shape[0]):
        for j in range(topography.shape[1]):
            dis = ((coord[0] - i)**2 + (coord[1] - j)**2)**0.5
            if dis <= radius:
                topography[i, j] += int(luminance * decline(dis))
#代价扩散(地形图,起点)
def cost_spread(topography, start):
    direction = ((-1, 0), (0, -1), (1, 0), (0, 1), (-1, -1), (-1, 1), (1, -1), (1, 1))
    # 可行方向为周围8个方向,优先上下左右
    cost_map = np.zeros_like(topography, dtype=np.uint) - 1	# 代价图,初始化为uint的最大值
    cost_map[start] = topography[start]	# 更新起点代价
    backtrack_map = np.zeros((topography.shape[0], topography.shape[1], 2), dtype=np.uint)	# 回溯图,记录回溯坐标
    points = [start]	# 更新点队列
    while points:
        x, y = points.pop(0)
        neighbor = filter(lambda p: 0 <= p[0] < topography.shape[0] and 0 <= p[1] < topography.shape[1],
                          ((x + i, y + j) for i, j in direction))	# 邻点迭代器
        for point in neighbor:	# 更新所有邻点
            if cost_map[x, y] + topography[point] < cost_map[point]:
                cost_map[point] = cost_map[x, y] + topography[point]	# 更新代价图
                backtrack_map[point] = x, y	# 更新回溯图
                points.append(point)	# 加入更新点队列
    return backtrack_map
# 多路径绘制(地形图,起点,终点列表)
def pathfinding(topography, start, end_list):
    if type(end_list) != list:
        end_list = [end_list]
    color_map = cm.ScalarMappable(norm=colors.Normalize(vmin=0, vmax=len(end_list) - 1),
                                  cmap=plt.get_cmap('gist_rainbow'))
    backtrack_map = cost_spread(topography, start)
    plt.figure(figsize=(topography.shape[1]/5, topography.shape[0]/5))
    plt.imshow(img, cmap='gray')
    for i in trange(len(end_list)-1, -1, -1):
        x, y = end_list[i]
        color = color_map.to_rgba(i)
        plt.scatter(y, x, color=color, marker='d')
        while True:
            if (x, y) == start:
                break
            last_x, last_y = backtrack_map[x, y]
            plt.plot((y, last_y), (x, last_x), color=color, linewidth=3)
            x, y = last_x, last_y
    plt.scatter(start[1], start[0], color=color_map.to_rgba(0))
    plt.savefig('path.png')
    # plt.show()
# 全路径绘制(地形图,起点)
# 相较于多路径绘制大幅度优化了绘制速度
def allpathfinding(topography, start):
    end_list = [(i, j) for i in range(topography.shape[0]) for j in range(topography.shape[1])]
    end_list.reverse()
    color_map = cm.ScalarMappable(norm=colors.Normalize(vmin=0, vmax=len(end_list)-1),
                                  cmap=plt.get_cmap('gist_rainbow'))
    backtrack_map = cost_spread(topography, start)
    plt.figure(figsize=(topography.shape[1]/5, topography.shape[0]/5))
    plt.imshow(img, cmap='gray')
    while end_list:
        print(len(end_list))
        x, y = end_list.pop()
        color = color_map.to_rgba(topography.shape[1]*x + y)
        while True:
            if (x, y) == start:
                break
            last_x, last_y = backtrack_map[x, y]
            plt.plot((y, last_y), (x, last_x), color=color, linewidth=2)
            x, y = last_x, last_y
            if (last_x, last_y) in end_list:
                end_list.remove((last_x, last_y))
            else:
                break
    plt.savefig('path.png')
