二分K-均值聚类算法
原始数据:testSet2.txt
3.275154 2.957587
-3.344465 2.603513
0.355083 -3.376585
1.852435 3.547351
-2.078973 2.552013
-0.993756 -0.884433
2.682252 4.007573
-3.087776 2.878713
-1.565978 -1.256985
2.441611 0.444826
-0.659487 3.111284
-0.459601 -2.618005
2.177680 2.387793
-2.920969 2.917485
-0.028814 -4.168078
3.625746 2.119041
-3.912363 1.325108
-0.551694 -2.814223
2.855808 3.483301
-3.594448 2.856651
0.421993 -2.372646
1.650821 3.407572
-2.082902 3.384412
-0.718809 -2.492514
4.513623 3.841029
-4.822011 4.607049
-0.656297 -1.449872
1.919901 4.439368
-3.287749 3.918836
-1.576936 -2.977622
3.598143 1.975970
-3.977329 4.900932
-1.791080 -2.184517
3.914654 3.559303
-1.910108 4.166946
-1.226597 -3.317889
1.148946 3.345138
-2.113864 3.548172
0.845762 -3.589788
2.629062 3.535831
-1.640717 2.990517
-1.881012 -2.485405
4.606999 3.510312
-4.366462 4.023316
0.765015 -3.001270
3.121904 2.173988
-4.025139 4.652310
-0.559558 -3.840539
4.376754 4.863579
-1.874308 4.032237
-0.089337 -3.026809
3.997787 2.518662
-3.082978 2.884822
0.845235 -3.454465
1.327224 3.358778
-2.889949 3.596178
-0.966018 -2.839827
2.960769 3.079555
-3.275518 1.577068
0.639276 -3.412840
代码:
from numpy import *
from math import *

'''loadDataSet(fileName)函数将文本文件导入到一个列表中,
文本文件每一行为tab分隔的浮点数,
每一个列表会被添加到dataMat中,最后返回dataMat,
该返回值是一个包含许多其他列表的列表,
这种格式可以很容易将很多值封装到矩阵中。'''
def loadDataSet(fileName):      #general function to parse tab -delimited floats
    dataMat = []                #assume last column is target value
    fr = open(fileName)
    for line in fr.readlines():
        curLine = line.strip().split('\t')
        fltLine = list(map(float,curLine)) #map all elements to float()
        dataMat.append(fltLine)
    return dataMat

'''distEclud(vecA, vecB)函数计算两个向量的欧式距离'''
def distEclud(vecA, vecB):
    return math.sqrt(sum(power(vecA - vecB, 2))) #la.norm(vecA-vecB)

'''randCent()函数为给定数据集构建一个包含k个随机质心的集合。
随机质心必须要在整个数据集的边界之内,这可以通过找到数据集每一维的最小值和最大值来完成。
然后生成0到1.0之间的随机数并通过取值范围和最小值,以便确保随机点在数据的边界之内。'''
def randCent(dataSet, k):
    n = shape(dataSet)[1]
    centroids = mat(zeros((k,n)))#create centroid mat
    for j in range(n):#create random cluster centers, within bounds of each dimension
        minJ = min(dataSet[:,j])
        rangeJ = float(max(dataSet[:,j]) - minJ)
        centroids[:,j] = mat(minJ + rangeJ * random.rand(k,1))
    return centroids

'''
两个必选参数:
dataSet:该参数为给定的数据集,
k:该参数为簇的数目,
两个可选的参数:
distEclud:计算两个向量组之间的距离,
'''def biKmeans(dataSet, k, distMeas=distEclud):
    m = shape(dataSet)[0]
    clusterAssment = mat(zeros((m,2)))
    centroid0 = mean(dataSet, axis=0).tolist()[0]
    centList =[centroid0] #create a list with one centroid
    for j in range(m):#calc initial Error
        clusterAssment[j,1] = distMeas(mat(centroid0), dataSet[j,:])**2
    while (len(centList) < k):
        lowestSSE = inf
        for i in range(len(centList)):
            ptsInCurrCluster = dataSet[nonzero(clusterAssment[:,0].A==i)[0],:]#get the data points currently in cluster i
            centroidMat, splitClustAss = kMeans(ptsInCurrCluster, 2, distMeas)
            sseSplit = sum(splitClustAss[:,1])#compare the SSE to the currrent minimum
            sseNotSplit = sum(clusterAssment[nonzero(clusterAssment[:,0].A!=i)[0],1])
            print("sseSplit, and notSplit: ",sseSplit,sseNotSplit)
            if (sseSplit + sseNotSplit) < lowestSSE:
                bestCentToSplit = i
                bestNewCents = centroidMat
                bestClustAss = splitClustAss.copy()
                lowestSSE = sseSplit + sseNotSplit
        bestClustAss[nonzero(bestClustAss[:,0].A == 1)[0],0] = len(centList) #change 1 to 3,4, or whatever
        bestClustAss[nonzero(bestClustAss[:,0].A == 0)[0],0] = bestCentToSplit
        print('the bestCentToSplit is: ',bestCentToSplit)
        print('the len of bestClustAss is: ', len(bestClustAss))
        centList[bestCentToSplit] = bestNewCents[0,:].tolist()[0]#replace a centroid with two best centroids
        centList.append(bestNewCents[1,:].tolist()[0])
        clusterAssment[nonzero(clusterAssment[:,0].A == bestCentToSplit)[0],:]= bestClustAss#reassign new clusters, and SSE
    return mat(centList), clusterAssment
结果:
>>> import kMeans
>>> from numpy import *
>>> datMat3 = mat(kMeans.loadDataSet('testSet2.txt'))
>>> centList,myNewAssments = kMeans.biKmeans(datMat3, 3)
[[ 0.26987696 -3.28064982]
[ 3.50813038 -3.6198256 ]]
[[-1.26225285 0.68367935]
[ 3.47144757 3.00503979]]
[[-1.70351595 0.27408125]
[ 2.93386365 3.12782785]]
sseSplit, and notSplit: 541.2976292649145 0.0
the bestCentToSplit is: 0
the len of bestClustAss is: 60
[[-4.74513879 -1.43065754]
[-0.05209199 3.08915112]]
[[-0.74459109 -2.39373345]
[-2.87553522 3.53474367]]
[[-0.45965615 -2.7782156 ]
[-2.94737575 3.3263781 ]]
sseSplit, and notSplit: 67.2202000797829 39.52929868209309
[[2.01125497 0.89234622]
[3.43187479 1.67391425]]
[[1.63926033 2.382914 ]
[3.16232306 3.25928324]]
[[1.76645283 2.74857633]
[3.43418257 3.29036421]]
[[1.788374 2.990118 ]
[3.55066577 3.20197931]]
sseSplit, and notSplit: 25.194262086233078 501.7683305828214
the bestCentToSplit is: 0
the len of bestClustAss is: 40
质心为:
>>> centList
matrix([[-0.45965615, -2.7782156 ],
[ 2.93386365, 3.12782785],
[-2.94737575, 3.3263781 ]])
centList2.txt:
-0.45965615,-2.7782156
2.93386365,3.12782785
-2.94737575,3.3263781
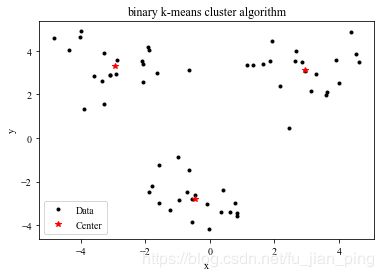
结果可视化:
代码:
"""
二分K-均值聚类算法
"""

import matplotlib.pyplot as plt
import numpy as np
import matplotlib as mpl

mpl.rcParams['font.family'] = 'sans-serif'
mpl.rcParams['font.sans-serif'] = 'NSimSun,Times New Roman'

x, y = np.loadtxt('testSet2.txt', delimiter='\t', unpack=True)
m, n = np.loadtxt('centList2.txt', delimiter=',', unpack=True)
plt.plot(x, y, '.', label='Data', color='black')
plt.plot(m, n, '*', label='Center', color='red')

plt.xlabel('x')
plt.ylabel('y')
plt.title('binary k-means cluster algorithm')
plt.legend()
plt.show()
运行结果:
