python实现线性回归算法
前言:学习了吴恩达机器学习线性回归部分内容后,再结合很多优秀博客总结,搬运出来的干货。
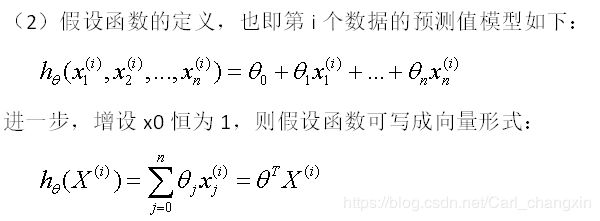
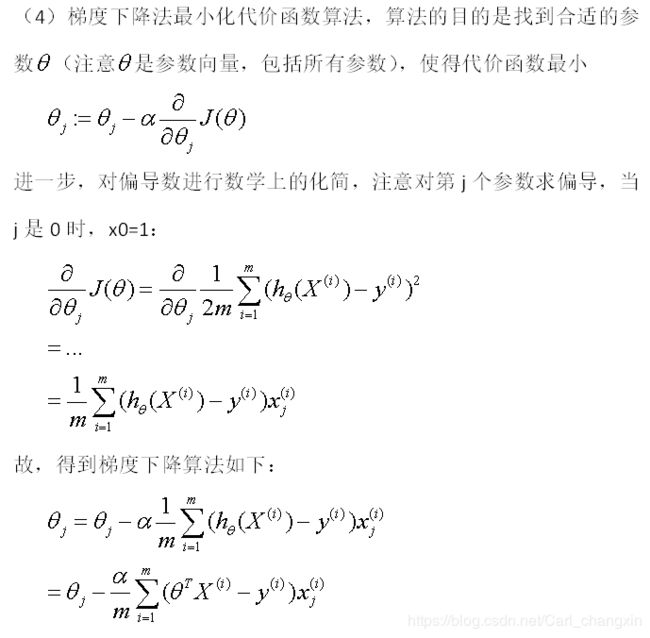
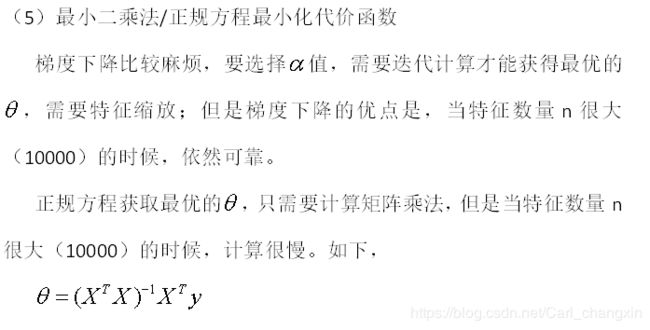
1、原理
2、单变量线性回归
数据准备:https://blog.csdn.net/Carl_changxin/article/details/100824723,第一列当作人口Population,第二列当作收益Profite
实现技术:梯度下降
实现目标:
(1)作原始数据散点图
(2)作线性回归模型折线图
(3)根据模型预测一些数据
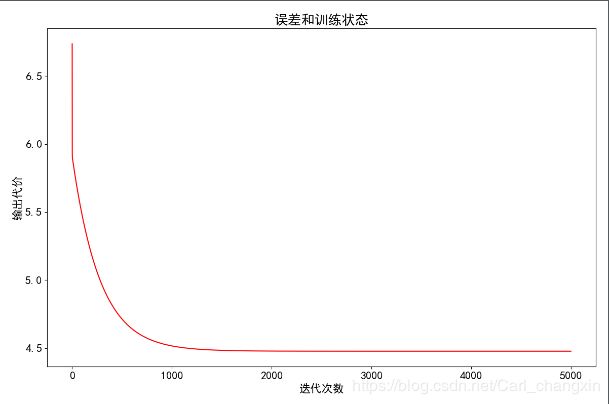
(4)作代价函数随迭代次数增加而变化的折线图;会发现代价函数慢慢趋向某个最小值,从而调整迭代次数
(5)作代价函数和参数的3d图;会发现代价函数属于凸函数,只有全局最小值
(6)作代价函数和参数的等高线图;即由3d图投影所得,可观察参数变化过程
实现代码:如下
# 1、单变量线性回归python实现
import pandas as pd
import matplotlib.pyplot as plt
import numpy as np
from matplotlib.colors import LogNorm
from mpl_toolkits.mplot3d import axes3d, Axes3D

'''
分析难点:
(1)hypothesis = X * theta.T
X = [x0 x1 x2 ... xn],其中x0~xn是m*1的列向量,所有X是m*(n+1)的矩阵;
X是包含所有训练数据的特征矩阵,每一行都代表一条数据
theta = [theta0 theta1 theta2 ... theta-n],1*(n+1)参数向量
所以hypothesis的值是m*1的向量,包含所有测试值的向量
(2)theta = theta - (alpha/y.size) * ((X * theta.T - y).T * X)
根据上面的分析X * theta.T是m*1的向量,包含所有测试值的向量;
(X * theta.T - y).T就是1*m的行向量,X是m*(n+1)的矩阵,故相乘结果为1*(n+1)的向量;
'''


# 代价函数;X=[x0 x1 ...xn]是m*(n+1)的矩阵,y=[m*1列向量],theta=[1*(n+1)行向量]
def computeCost(X, y, theta):
    # 假设函数;由于X中包含所有训练数据,所以得到的结果是所有测试结果组成的m*1列向量
    hypothesis = X * theta.T
    # 训练数据个数,或者用m = y.shape[1]
    m = y.size
    # 代价函数
    J = 1 / (2 * m) * np.sum(np.power(hypothesis - y, 2))
    return J


# 梯度下降函数;X=[x0 x1 ...xn]是m*(n+1)的矩阵,y=[m*1列向量],theta=[1*(n+1)行向量]
def gradientDescent(X, y, theta, alpha, iters):
    # cost用来记录迭代每一次的代价函数值;用长度为iters的数组记录;初始化为0
    cost = np.zeros(iters)
    # thetaRecord记录每一次迭代的theta;thetaRecord是二维数组
    thetaRecord = np.zeros([iters, 2])
    # 每迭代一次,就要循环更新一次所有参数的值
    for i in range(iters):
        thetaRecord[i] = np.array(theta)[0]
        theta = theta - (alpha / y.size) * ((X * theta.T - y).T * X)  # 更新theta向量
        cost[i] = computeCost(X, y, theta)
    return theta, cost, thetaRecord


if __name__ == '__main__':
    # ---绘图设置参数---
    font = {
        'family': 'SimHei',
        'weight': 'bold',
        'size': '16'
    }
    plt.rc('font', **font)
    plt.rc('axes', unicode_minus=False)

    # (1)读取训练数据集,并绘制数据集散点图
    train_data = pd.read_csv('ex1data1.txt', names=['Population', 'Profit'])
    train_data.plot(kind='scatter', x='Population', y='Profit', figsize=(12, 8))
    plt.show()

    # 初始化变量
    train_data.insert(0, 'Ones', 1)
    X = train_data.iloc[:, [0, 1]]
    y = train_data.iloc[:, 2]
    X = np.mat(X.values)  # X是矩阵
    y = np.mat(y.values)
    y = y.T  # 将y变成列向量
    theta = np.mat('0 0')
    iters = 5000
    alpha = 0.01
    bestPara, cost, thetaRecord = gradientDescent(X, y, theta, alpha, iters)

    # (2)画出线性回归函数
    x = np.linspace(train_data.Population.min(), train_data.Population.max(), 100)
    f = bestPara[0, 0] + (bestPara[0, 1] * x)
    fig, ax = plt.subplots(figsize=(12, 8))
    # 将两个图像绘制在同一个figure上
    ax.plot(x, f, 'r', label='预测函数')  # 预测函数折线图
    ax.scatter(train_data.Population, train_data.Profit, label='训练数据')  # 训练数据散点图
    ax.legend(loc=2)
    ax.set_xlabel('人口')
    ax.set_ylabel('利润')
    ax.set_title('预测利润和人口数量')
    plt.show()

    # (3)预测人口规模为3.5万和7万的利润值
    predict1 = bestPara[0, 0] * 1 + (bestPara[0, 1] * 3.5)
    print('当人口为35,000时,我们预测利润为', predict1 * 10000)
    predict2 = bestPara[0, 0] * 1 + (bestPara[0, 1] * 7)
    print('当人口为70,000时,我们预测利润为', predict2 * 10000)

    # (4)画出代价函数随迭代次数增长而变化的图像
    # subplots的返回值有figure, Axes对象
    fig, ax = plt.subplots(figsize=(12, 8))
    ax.plot(np.arange(iters), cost, 'r')  # 绘图
    ax.set_xlabel('迭代次数')
    ax.set_ylabel('输出代价')
    ax.set_title('误差和训练状态')
    plt.show()

    # (5)画出代价函数和参数的3d图像和等高线图
    theta0_vals = np.linspace(-10, 10, 100)
    theta1_vals = np.linspace(-1, 4, 100)
    xs, ys = np.meshgrid(theta0_vals, theta1_vals)
    J_vals = np.zeros(xs.shape)
    for i in range(0, theta0_vals.size):
        for j in range(0, theta1_vals.size):
            t = np.array([theta0_vals[i], theta1_vals[j]])
            t = np.mat(t)
            J_vals[i][j] = computeCost(X, y, t)
    J_vals = np.transpose(J_vals)  # 转置函数,转成行向量
    # 绘制3D图
    fig1 = plt.figure(2)
    ax = fig1.gca(projection='3d')  # 将figure变为3d
    ax.plot_surface(xs, ys, J_vals)  # 绘制3D图
    plt.xlabel(r'$\theta_0$')
    plt.ylabel(r'$\theta_1$')
    # 绘制等高线,观察迭代过程中参数的变化
    plt.figure(3)
    lvls = np.logspace(-2, 3, 20)  # 表示20**-2,20**-1,...20**3
    plt.contour(xs, ys, J_vals, levels=lvls, norm=LogNorm())  # 绘制等高线
    # for i in range(iters):
    #     plt.plot(thetaRecord[i][0], thetaRecord[i][1], c='r', marker="x")

    # 若不想观察所有的点,可以每隔500次迭代绘制一次
    for i in range(0, iters, 500):
        plt.plot(thetaRecord[i][0], thetaRecord[i][1], c='r', marker="x")
    # 最后一次,手动输出
    plt.plot(thetaRecord[iters - 1][0], thetaRecord[iters - 1][1], c='r', marker="x")
    plt.show()
实现截图:
3、多元线性回归
数据准备:https://blog.csdn.net/Carl_changxin/article/details/100824723,
实现技术:梯度下降,特征缩放(均值归一化)
实现目标:
(1)训练数据,得到最佳参数theta;测试数据,预测结果
实现代码:
# 1、二元线性回归python实现
import pandas as pd
import matplotlib.pyplot as plt
import numpy as np
from matplotlib.colors import LogNorm
from mpl_toolkits.mplot3d import axes3d, Axes3D


# 代价函数;X=[x0 x1 ...xn]是m*(n+1)的矩阵,y=[m*1列向量],theta=[1*(n+1)行向量]
def computeCost(X, y, theta):
    # 假设函数;由于X中包含所有训练数据,所以得到的结果是所有测试结果组成的m*1列向量
    hypothesis = X * theta.T
    # 训练数据个数,或者用m = y.shape[1]
    m = y.size
    # 代价函数
    J = 1 / (2 * m) * np.sum(np.power(hypothesis - y, 2))
    return J


# 梯度下降函数;X=[x0 x1 ...xn]是m*(n+1)的矩阵,y=[m*1列向量],theta=[1*(n+1)行向量]
def gradientDescent(X, y, theta, alpha, iters):
    # cost用来记录迭代每一次的代价函数值;用长度为iters的数组记录;初始化为0
    # cost = np.zeros(iters)
    # 每迭代一次,就要循环更新一次所有参数的值
    for i in range(iters):
        theta = theta - (alpha / y.size) * ((X * theta.T - y).T * X)  # 更新theta向量
        # cost[i] = computeCost(X, y, theta)
    return theta


# 特征缩放
def featureNormalize(X):
    X_norm = X
    mu = np.zeros((1, X.shape[1]))
    sigma = np.zeros((1, X.shape[1]))
    for i in range(X.shape[1]):
        mu[0, i] = np.mean(X[:, i])  # 均值
        sigma[0, i] = np.std(X[:, i])  # 标准差
    X_norm = (X - mu) / sigma
    return X_norm, mu, sigma


if __name__ == '__main__':
    # 读取训练数据集
    train_data = pd.read_csv('ex1data2.txt', names=['id', 'feature1', 'feature2', 'feature3', 'label'])
    # 删除id列
    train_data = train_data.drop(columns=['id'])

    # 初始化变量
    X = train_data.iloc[:, [0, 1, 2]]
    y = train_data.iloc[:, 3]
    X = np.mat(X.values)  # X从DataFrame类型转化成矩阵
    y = np.mat(y.values)
    y = y.T  # 将y变成列向量
    # 特征缩放
    X, mu, sigma = featureNormalize(X)
    # 特征缩放后再新增x0列
    b = np.ones(y.size)
    X = np.insert(X, 0, values=b, axis=1)
    theta = np.mat(np.zeros(X.shape[1]))
    iters = 5000
    alpha = 0.01

    # (1)训练数据,得到最佳参数theta;测试数据,预测结果
    # 训练
    bestPara = gradientDescent(X, y, theta, alpha, iters)
    # 测试
    data = [151.5, 41.3, 58.5]
    testx = np.mat(data)
    # 对测试数据进行特征缩放
    testx = ((testx - mu) / sigma)
    # 对测试数据添加x0列
    b = np.ones(testx.shape[0])
    testx = np.insert(testx, 0, values=b, axis=1)
    # print(testx)
    # print(bestPara)
    # dot方法,返回两个数组的内积;返回矩阵的乘积
    price = testx.dot(bestPara.T)
    # predit value is 17.597830
    print('predit value is %f ' % (price))


