sklearn中集成学习(下)
******************************************************************************
这部分有些地方没有翻译,笔者自己不是能很好理解。希望大家多多帮助!
******************************************************************************
1.11.3AdaBoost
▲sklearn.ensemble模块包含了最为流行的提升算法Adaboosting。其核心拟合一系列的弱学习器(如比随机猜想好的模型,小决策树),反复修正数据集的权值。最终的预测结果通过对各个弱学习器投票的方式获得。在每次迭代过程中,对每个样本添加权值w1,w2,w3,…,wn。刚开始每个权值都相等,且都为1/N,因此第一步训练的弱学习器相当于在原始数据上进行训练。在每次成功的迭代当中,样本权值分别被修改,算法也就在加权的数据上进行。在每一步中,被分类错误的样本的权值会相对增加,相反的,被正确分类的权值会减少。因此在迭代过程中,很难预测正确的样本会受到更加的关注,后续的弱学习器会被强制的去针对这些样本。Adaboost可以用于解决分类和回归问题。
- 对于多分类问题,AdaboostClassifier实现了AdaBoost-SAMME和AdaaBoost-SAMME.R
- 对于回归问题,AdaboostRegressor实现了AdaBoost.R2
1.11.3.1 使用
▲下面的例子展示了AdaBoost算法拟合100个弱学习器:
>>> from sklearn.model_selection import cross_val_score
>>> from sklearn.datasets import load_iris
>>> from sklearn.ensemble import AdaBoostClassifier

>>> iris = load_iris()
>>> clf = AdaBoostClassifier(n_estimators=100)
>>> scores = cross_val_score(clf, iris.data, iris.target)
>>> scores.mean()
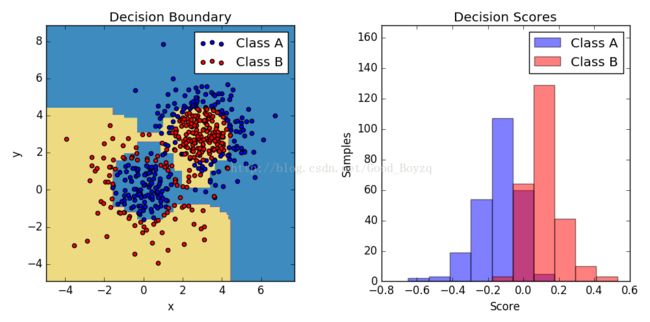
0.9...▲n_estimators为弱学习器的数量,learning_rate为每个学习器的贡献率。默认情况下,若学习器为决策树,base_estimator可以指定弱学习器。调整n_estimators和基学习器可以获得好的结果。下面的例子展示了使用AdaBoost-SaMME解决非线性问题:http://scikit-learn.org/stable/auto_examples/ensemble/plot_adaboost_twoclass.html#sphx-glr-auto-examples-ensemble-plot-adaboost-twoclass-py
相关代码:
# -*- coding: utf-8 -*-
"""
Created on Thu Jan 26 18:08:51 2017

@author: ZQ
"""

import numpy as np
import matplotlib.pyplot as plt

from sklearn.ensemble import AdaBoostClassifier
from sklearn.tree import DecisionTreeClassifier
from sklearn.datasets import make_gaussian_quantiles

#构造数据集
X1,y1 = make_gaussian_quantiles(cov=2.0,
                                n_samples=200,
                                n_features=2,
                                n_classes=2,
                                random_state=1)
X2,y2 = make_gaussian_quantiles(mean=(3,3),
                                cov=1.5,
                                n_samples=300,
                                n_features=2,
                                n_classes=2,
                                random_state=1)
X = np.concatenate((X1,X2))
y = np.concatenate((y1,-y2+1))

#拟合提升树
bdt = AdaBoostClassifier(DecisionTreeClassifier(max_depth=1),
                         algorithm="SAMME",
                         n_estimators=200)

bdt.fit(X,y)

plot_colors = 'br'
plot_step = 0.02
class_names = 'AB'

plt.figure(figsize = (10,5))
#决策边界
plt.subplot(121)
x_min,x_max = X[:,0].min()-1,X[:,0].max()+1
y_min,y_max = X[:,1].min()-1,X[:,1].max()+1

xx,yy = np.meshgrid(np.arange(x_min,x_max,plot_step),
                    np.arange(y_min,y_max,plot_step))
Z = bdt.predict(np.c_[xx.ravel(),yy.ravel()])
Z = Z.reshape(xx.shape)
cs = plt.contourf(xx,yy,Z,cmap = plt.cm.Paired)
plt.axis("tight")

#训练点
for i,n,c in zip(range(2),class_names,plot_colors):
    idx = np.where(y==i)
    plt.scatter(X[idx,0],X[idx,1],
                c=c,cmap=plt.cm.Paired,
                label="Class %s"%n)
plt.xlim(x_min,x_max)
plt.ylim(y_min,y_max)
plt.legend(loc='upper right')
plt.xlabel('x')
plt.ylabel('y')
plt.title('Decision Boundary')

#两类的分类情况
twoclass_output = bdt.decision_function(X)
plot_range = (twoclass_output.min(),twoclass_output.max())
plt.subplot(122)
for i,n,c in zip(range(2),class_names,plot_colors):
    plt.hist(twoclass_output[y==i],
             bins=10,
             range=plot_range,
             facecolor=c,
             label='Class %s'%n,
             alpha=0.5)
x1, x2, y1, y2 = plt.axis()
plt.axis((x1, x2, y1, y2 * 1.2))
plt.legend(loc='upper right')
plt.ylabel('Samples')
plt.xlabel('Score')
plt.title('Decision Scores')

plt.tight_layout()
plt.subplots_adjust(wspace=0.35)
plt.show()
1.11.4 梯度树提升(GradientTree Boosting)
▲梯度树提升和梯度树回归(GBRT)一种泛化的提升算法,利用任意微损失函数(arbitrary differentiable loss functions)。GBRT是一个准确率高、有效的算法,可以解决回归和分类问题。该模型被广泛应用到各个领域,包括网络搜索排名。
▲GBRT的优点包括:
- 可以对混合数据类型进行自然处理(非均值特征)
- 预测能力
- 对输出空间中的异常数据具有鲁棒性(通过鲁棒损失函数)
▲GBRT的缺点包括:
- 由于其序列性,很难进行并行运算
Sklearn.ensemble模块中的梯度提升随机回归树提供了分类和回归两种算法
1.11.4.1 分类(classification)
▲GradientBoostingClassifier支持两类和多类分类问题。接下来的例子展示了使用100个单层决策树来拟合梯度提升分类器:
>>> from sklearn.datasets import make_hastie_10_2
>>> from sklearn.ensemble import GradientBoostingClassifier

>>> X, y = make_hastie_10_2(random_state=0)
>>> X_train, X_test = X[:2000], X[2000:]
>>> y_train, y_test = y[:2000], y[2000:]

>>> clf = GradientBoostingClassifier(n_estimators=100, learning_rate=1.0,
...     max_depth=1, random_state=0).fit(X_train, y_train)
>>> clf.score(X_test, y_test)
0.913...
▲n_estimators:弱学习器数量;max_depth和max_leaf_nodes决定每个树的大小;learning_rate在0.0到1.0范围内,通过shrinkage控制过拟合。
▲注:在数据量大的时候建议使用RandomForestClassifier代替GradientBoostingClassifier。
1.11.4.2 回归(Regression)
▲GradientBoostingRegressor支持一系列的损失函数,可通过参数loss设置,默认的损失函数为最小平方损失(‘ls’)
>>> import numpy as np
>>> from sklearn.metrics import mean_squared_error
>>> from sklearn.datasets import make_friedman1
>>> from sklearn.ensemble import GradientBoostingRegressor

>>> X, y = make_friedman1(n_samples=1200, random_state=0, noise=1.0)
>>> X_train, X_test = X[:200], X[200:]
>>> y_train, y_test = y[:200], y[200:]
>>> est = GradientBoostingRegressor(n_estimators=100, learning_rate=0.1,
...     max_depth=1, random_state=0, loss='ls').fit(X_train, y_train)
>>> mean_squared_error(y_test, est.predict(X_test))
5.00…
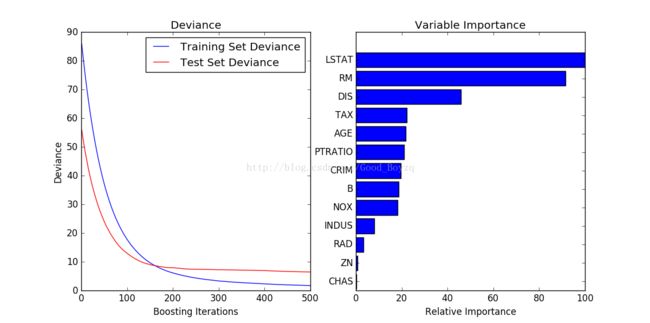
▲下图展示了使用最小平方损失、500个基学习器的梯度提升回归对波士顿房价的拟合。图展示了训练样本和测试样本在每次迭代中的错误率。每次迭代的训练样本的错误率保存在模型的train_score_中。测试样本的错误率可以通过staged_predict方法获得,该方法返回一个生成器,用于生成每个阶段的预测。像这样的曲线可以通过提前停止来确定树的最优数量,即参数:n_estimators。右图显示了特征的重要程度,可通过fearture_importances_property获得。
相关代码:
# -*- coding: utf-8 -*-
"""
Created on Fri Jan 27 17:05:24 2017

@author: ZQ
"""

import numpy as np
import matplotlib.pyplot as plt

from sklearn import ensemble
from sklearn import datasets
from sklearn.utils import shuffle
from sklearn.metrics import mean_squared_error

#加载数据
boston = datasets.load_boston()
X,y = shuffle(boston.data,boston.target,random_state = 13)
X = X.astype(np.float32)
offset = int(X.shape[0]*0.9)
X_train,y_train = X[:offset],y[:offset]
X_test,y_test = X[offset:],y[offset:]

#拟合回归模型
params = {'n_estimators': 500, 'max_depth': 4, 'min_samples_split': 2,
          'learning_rate': 0.01, 'loss': 'ls'}
clf = ensemble.GradientBoostingRegressor(**params)
clf.fit(X_train,y_train)
mse = mean_squared_error(y_test,clf.predict(X_test))
print("MSE:%.4f"%mse)

#下降曲线
test_score = np.zeros((params['n_estimators'],),dtype=np.float64)

for i,y_pred in enumerate(clf.staged_predict(X_test)):
    test_score[i] = clf.loss_(y_test,y_pred)

plt.figure(figsize=(12,6))
plt.subplot(1,2,1)
plt.title('Deviance')
plt.plot(np.arange(params['n_estimators'])+1,clf.train_score_,
         'b-',label = 'Training Set Deviance')
plt.plot(np.arange(params['n_estimators']) + 1, test_score, 'r-',
         label='Test Set Deviance')
plt.legend(loc='upper right')
plt.xlabel('Boosting Iterations')
plt.ylabel('Deviance')

#重要特征
feature_importance = clf.feature_importances_

feature_importance = 100.0*(feature_importance/feature_importance.max())
sorted_idx = np.argsort(feature_importance)
pos = np.arange(sorted_idx.shape[0])+0.5
plt.subplot(1, 2, 2)
plt.barh(pos, feature_importance[sorted_idx], align='center')
plt.yticks(pos, boston.feature_names[sorted_idx])
plt.xlabel('Relative Importance')
plt.title('Variable Importance')
plt.show()
1.11.4.3 拟合额外的弱学习器
▲GradientBoostingRegressor和GradientBoostingClassifier都可以通过参数warm_start=True,对已经拟合好的模型添加额外的学习模型:
>>> _ = est.set_params(n_estimators=200, warm_start=True)
>>> _ = est.fit(X_train, y_train)
>>> mean_squared_error(y_test, est.predict(X_test))
3.84…
1.11.4.4 控制树的大小
▲回归树的大小定义了在梯度提升模型中可获取的交互变量。一般的,可通过顺序的h来获取树的深度h。这里有两种方法来控制树的大小。如果指定max_depth=h,则会生产深度为h的完全二叉树,这些树至少有2**h个叶节点,其他节点树至少有2**h-1。或者,可以通过参数max_leaf_nodes来控制叶节点的数量,从而来控制树的大小;In this case, trees will be grown usingbest-first search where nodes with the highest improvement in impurity will beexpanded first;设置max_leaf_nodes=k,将有k-1个分节点,因此模型可以接着试max_leaf_nodes-1。通过实验发现,max_leaf_nodes=k与max_depth=k-1相比,前者收敛速度快,但是有稍微高点的训练误差。
1.11.4.5 数学公式(Mathematicalformulation)
该部分相关在《统计学习理论》和《机器学习》中找到对应的,且详细。
1.11.4.5.1 损失函数(Loss Function)
▲支持以下的损失函数,并且可以通过参数loss指定:
- 回归:
- 最小平方(‘ls’):由于其计算属性作为回归的默认选择;其初模型为均值。
- 最小绝对偏差(‘lad’):具有一定的鲁棒性;初始模型为中位数。
- HUber(‘huber’):另一种具有鲁棒性的方法,其结合了ls和lad;可以通过alpha参数来控制其对异常值的敏感性。
- 分位数(‘quantile’):使用0<alpha<1来制定分位数;该损失函数可以用来预测区间。
- 分类:
- 二项式(‘deviance’):对于二分类的负二项式对数似然损失函数;其初始模型为比值的对数。
- 多项式:对于多分类的负多项式对数似然损函数;提供了概率估计;初始模型为每种类别的先验概率。
- 指数损失函数(‘exponential’):只能在二分类时使用。
1.11.4.6 正则化(Regularization)
▲正则化是模型选择的一种方式,采用结构风险最小化的策略实现,是在经验风险上加上一个正则化项。
1.11.4.6.1 收缩(Shrinkage)

▲v为学习率,可通过参数learning_rate设置;该参数的大小与弱学习器个数有关;较小的学习率需要较多的学习器去维持训练样本的错误率;实验表明,较小的学习率具有很好的测试错误率;因此推荐使用较小的常数(learning_rate<=0.1)
1.11.4.6.2 抽样(Subsampling)
▲提出了随机梯度提升算法,其结合了梯度提升和引导平均(bagging)。在每次迭代中基分类器使用训练样本的部分数据。选取的样本不是重复选择,一个典型的取值为0.5。下图展示了收缩(shrinkage)和抽样(subsampling)对模型的拟合效果;可以明确的观测到:有收缩的要优于无收缩的、采样与收缩结合可进一步提高模型的准确率、采样时不适用收缩表现效果比较差。
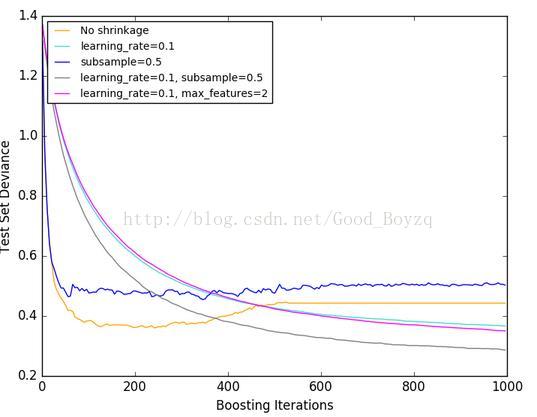
▲另一种减小方差的策略是对属性的采样,类似于RandomForestClassifier中的随机拆分;取样个数可以使用参数max_features来控制;max_features参数较小可以降低拟合时间。
▲Stochastic gradient boostingallows to compute out-of-bag estimates of the test deviance by computing theimprovement in deviance on the examples that are not included in the bootstrapsample (i.e. the out-of-bag examples). The improvements are stored in theattribute oob_improvement_. oob_improvement_[i] holds the improvement in termsof the loss on the OOB samples if you add the i-th stage to the currentpredictions. Out-of-bag estimates can be used for model selection, for exampleto determine the optimal number of iterations. OOB estimates are usually verypessimistic thus we recommend to use cross-validation instead and only use OOBif cross-validation is too time consuming.
1.11.4.7 解释(Interpretation)
▲单个决策树可以简单的使用可视化的树结构来解释。然而,梯度提升模型包含了数百个回归树,因此很难用可视化来表现。幸运地,有大量的技术去总结和解释梯度提升模型。
1.11.4.7.1 特征重要性(Feature importance)
▲不同特征对目标预测有不同的效果;在大多数情况下,许多特征都是无关紧要的。在解释一个模型时,首要解决的问题是:重要特征是什么,以及它们怎么样影响预测结果。单个决策树通过使用分割点选择特征;这种方法可以用于测量每个特征的重要性,其基本思想是:在决策树中经常作为分割点的特征,则为越重要的特征。可通过平均每颗树的特征的重要性的方式拓展到决策树集成中。
▲特征的重要程度可以通过属性feature_importances_获得:
>>> from sklearn.datasets import make_hastie_10_2
>>> from sklearn.ensemble import GradientBoostingClassifier
>>> X,y = make_hastie_10_2(random_state=0)
>>> clf = GradientBoostingClassifier(n_estimators=100,learning_rate=1.0,max_depth=1,random_state=0).fit(X,y)
>>> clf.feature_importances_
array([ 0.11,  0.1 ,  0.11,  0.1 ,  0.09,  0.11,  0.09,  0.1 ,  0.1 ,  0.09])
1.11.4.7.2 部分依赖性(Partialdependence)
▲部分依赖曲线(PDP)显示了目标相应和一组特征之间的独立性,排除了其他所有的特征。直观的,可将部分依赖解释为预期的目标响应,和目标特征的函数。由于对目标特征感知的大小限制集小(通过为一个或者两个),因此,目标特征通常选择其间重要的特征。
▲下图展示了对加州住房数据集绘制的4个单向和1个双向的部分依赖图:
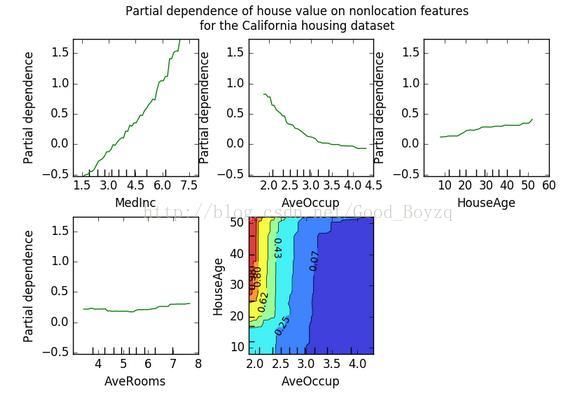
▲可从单向的PDP图获得目标相应和目标特征之间的相互作用。左上角的第一幅图展示了某个地区中收入水平的人的房屋价格,从图中可看出呈线性关系。具有两个特征的PDP图显示了两个特征之间的相关作用。例如,上图中具有两个变量的PDP图展示了中值房价联合房子年龄和每个家庭住户的均值。从中可以清楚的看到两个特征之间的相互作用:对于平均入住率大于2的,其房价与房子的年龄相互独立;小于2的则相反。
▲在模块partial_dependence中提供了计算one-way和two-way的部分依赖图(plot_partial_dependence)。下面的例子展示了创建部分依赖网格图:对于特征0和1的两个单向PDP图和一个双向PDP图:
>>> from sklearn.datasets import make_hastie_10_2
>>> from sklearn.ensemble import GradientBoostingClassifier
>>> from sklearn.ensemble.partial_dependence import plot_partial_dependence
>>> X, y = make_hastie_10_2(random_state=0)
>>> clf = GradientBoostingClassifier(n_estimators=100, learning_rate=1.0,
...     max_depth=1, random_state=0).fit(X, y)
>>> features = [0, 1, (0, 1)]
>>> fig, axs = plot_partial_dependence(clf, X, features)
▲在多分类中,需要通过label参数为每个PDP设置标签:
>>> from sklearn.datasets import load_iris
>>> iris = load_iris()
>>> mc_clf = GradientBoostingClassifier(n_estimators=10,
...     max_depth=1).fit(iris.data, iris.target)
>>> features = [3, 2, (3, 2)]
>>> fig, axs = plot_partial_dependence(mc_clf, X, features, label=0)
▲可通过方法partial_dependence来获取部分依赖的原始值:
>>> from sklearn.ensemble.partial_dependence import partial_dependence
>>> pdp, axes = partial_dependence(clf, [0], X=X)
>>> pdp
array([[ 2.46643157,  2.46643157, ...
>>> axes
[array([-1.62497054, -1.59201391, ...
▲函数需要任意一个指定的目标特征的值的参数网格,其部分依赖函数需要估计;或者he argument X which is a convenience mode forautomatically creating grid from the training data.如果X确定,则该函数将返回每个特征的坐标。
▲对于网格中每个目标特征的值,其部分依赖函数需要排斥一棵树的预测对所有不出特征的值。在决策树中,该函数在没有参考训练数据的情况下有效的预测。对每个网格点中的加权树进行遍历:如果每个节点是目标特征,则遍历其应用左或者右的分支,否则遍历两个分支,每个分支通过样本输入的分数进行加权。最后,部分依赖通过遍历的叶节点的加权平均获得。对于集成树,其结果为每个树的平均。
1.11.5 投票分类器(VotingClassifier)
▲投票分类器的原理是结合了多个不同的机器学习分类器,使用多数票或者平均预测概率(软票),预测类标签。这类分类器对一组相同表现的模型十分有用,同时可以平衡各自的弱点。
1.11.5.1 多数类标签(Majority Class Labels)
▲预测类型的标签为该组学习器中相同最多的种类:例如给出的分类如下
- 分类器1 -> 标签1
- 分类器2 -> 标签1
- 分类器3 -> 标签2
▲投票分类器(voting=‘hard’)则该预测结果为‘标签1’。在各个都只有一个的情况下,则按照顺序来,如下:
- 分类器1 -> 标签2
- 分类器2 -> 标签1
最终结果为“标签2”
1.11.5.1.1 使用(Usage)
▲如下为拟合多数规则分类器:
>>> from sklearn import datasets
>>> from sklearn.model_selection import cross_val_score
>>> from sklearn.linear_model import LogisticRegression
>>> from sklearn.naive_bayes import GaussianNB
>>> from sklearn.ensemble import RandomForestClassifier
>>> from sklearn.ensemble import VotingClassifier
>>> iris = datasets.load_iris()
>>> X, y = iris.data[:, 1:3], iris.target
>>> clf1 = LogisticRegression(random_state=1)
>>> clf2 = RandomForestClassifier(random_state=1)
>>> clf3 = GaussianNB()
>>> eclf = VotingClassifier(estimators=[('lr', clf1), ('rf', clf2), ('gnb', clf3)], voting='hard')
>>> for clf, label in zip([clf1, clf2, clf3, eclf], ['Logistic Regression', 'Random Forest', 'naive Bayes', 'Ensemble']):
...     scores = cross_val_score(clf, X, y, cv=5, scoring='accuracy')
...     print("Accuracy: %0.2f (+/- %0.2f) [%s]" % (scores.mean(), scores.std(), label))
Accuracy: 0.90 (+/- 0.05) [Logistic Regression]
Accuracy: 0.93 (+/- 0.05) [Random Forest]
Accuracy: 0.91 (+/- 0.04) [naive Bayes]
Accuracy: 0.95 (+/- 0.05) [Ensemble]
1.11.5.2 加权平均概率(软投票)(Soft Voting)
▲相对于多数投票(hard voting),软投票返回预测概率值的总和最大的标签。可通过参数weights指定每个分类器的权重;若权重提供了,在计算时则会按照权重计算,然后取平均;标签则为概率最高的标签。
▲举例说明,假设有3个分类器,3个类,每个分类器的权重为:w1=1,w2=1,w3=1。如下表:
| 分类器 |
标签1 |
标签2 |
标签3 |
| 分类器1 |
W1*0.2 |
W1*0.5 |
W1*0.3 |
| 分类器2 |
W1*0.6 |
W1*0.3 |
W1*0.1 |
| 分类器3 |
W1*0.3 |
W1*0.4 |
W1*0.3 |
| 权重平均 |
0.37 |
0.4(√) |
0.23 |
▲下面例子为线性SVM,决策树,K邻近分类器:
>>> from sklearn import datasets
>>> from sklearn.tree import DecisionTreeClassifier
>>> from sklearn.neighbors import KNeighborsClassifier
>>> from sklearn.svm import SVC
>>> from itertools import product
>>> from sklearn.ensemble import VotingClassifier

>>> # Loading some example data
>>> iris = datasets.load_iris()
>>> X = iris.data[:, [0,2]]
>>> y = iris.target

>>> # Training classifiers
>>> clf1 = DecisionTreeClassifier(max_depth=4)
>>> clf2 = KNeighborsClassifier(n_neighbors=7)
>>> clf3 = SVC(kernel='rbf', probability=True)
>>> eclf = VotingClassifier(estimators=[('dt', clf1), ('knn', clf2), ('svc', clf3)], voting='soft', weights=[2,1,2])

>>> clf1 = clf1.fit(X,y)
>>> clf2 = clf2.fit(X,y)
>>> clf3 = clf3.fit(X,y)
>>> eclf = eclf.fit(X,y)
▲投票分类器的边界:
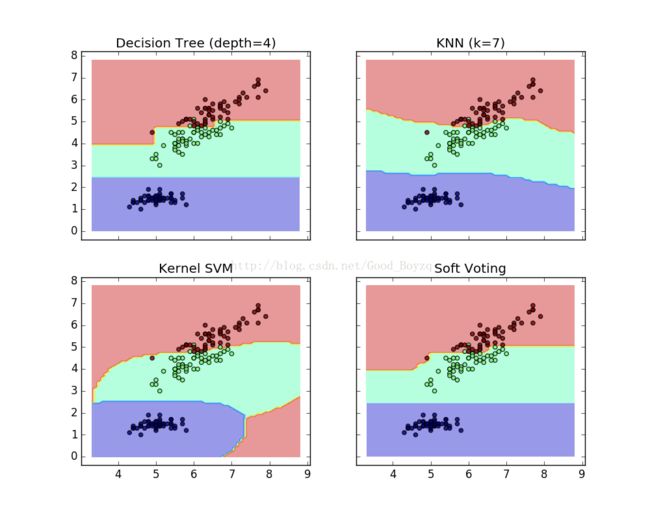
相关代码:
# -*- coding: utf-8 -*-
"""
Created on Wed Feb  1 16:22:39 2017

@author: ZQ
"""

from itertools import product

import numpy as np
import matplotlib.pyplot as plt

from sklearn import datasets
from sklearn.tree import DecisionTreeClassifier
from sklearn.neighbors import KNeighborsClassifier
from sklearn.svm import SVC
from sklearn.ensemble import VotingClassifier

#加载数据
iris = datasets.load_iris()
X = iris.data[:,[0,2]]
y = iris.target

#训练分类器
clf1 = DecisionTreeClassifier(max_depth=4)
clf2 = KNeighborsClassifier(n_neighbors=7)
clf3 = SVC(kernel='rbf',probability=True)
eclf = VotingClassifier(estimators=[('dt',clf1),
                                    ('knn',clf2),
                                    ('svc',clf3)],
                                    voting='soft',
                                    weights=[2,1,2])
clf1.fit(X,y)
clf2.fit(X,y)
clf3.fit(X,y)
eclf.fit(X,y)

#画分类边界
x_min,x_max = X[:,0].min()-1,X[:,0].max()+1
y_min,y_max = X[:,1].min()-1,X[:,1].max()+1
xx,yy = np.meshgrid(np.arange(x_min,x_max,0.1),
                    np.arange(y_min,y_max,0.1))
f, axarr = plt.subplots(2, 2, sharex='col', sharey='row', figsize=(10, 8))
for idx, clf, tt in zip(product([0, 1], [0, 1]),
                        [clf1, clf2, clf3, eclf],
                        ['Decision Tree (depth=4)', 'KNN (k=7)',
                         'Kernel SVM', 'Soft Voting']):

    Z = clf.predict(np.c_[xx.ravel(), yy.ravel()])
    Z = Z.reshape(xx.shape)

    axarr[idx[0], idx[1]].contourf(xx, yy, Z, alpha=0.4)
    axarr[idx[0], idx[1]].scatter(X[:, 0], X[:, 1], c=y, alpha=0.8)
    axarr[idx[0], idx[1]].set_title(tt)
plt.show()
1.11.5.3 网格搜索下的投票分类器(Using the VotingClassifier with GridSearch)
▲结合GridSearch可调整估计模型的参数:
>>> from sklearn.model_selection import GridSearchCV
>>> clf1 = LogisticRegression(random_state=1)
>>> clf2 = RandomForestClassifier(random_state=1)
>>> clf3 = GaussianNB()
>>> eclf = VotingClassifier(estimators=[('lr', clf1), ('rf', clf2), ('gnb', clf3)], voting='soft')
>>> params = {'lr__C': [1.0, 100.0], 'rf__n_estimators': [20, 200],}
>>> grid = GridSearchCV(estimator=eclf, param_grid=params, cv=5)
>>> grid = grid.fit(iris.data, iris.target)
1.11.5.3 使用
▲基于概率预测类标签(在投票分类器中,其分类函数必须支持predict_proba方法):
>>>eclf = VotingClassifier(estimators=[('lr', clf1), ('rf', clf2), ('gnb', clf3)],voting='soft')▲指定权重:
>>>eclf = VotingClassifier(estimators=[('lr', clf1), ('rf', clf2), ('gnb', clf3)],voting='soft', weights=[2,5,1])
