Python 实现DBSCAN 算法
一、基于密度的聚类
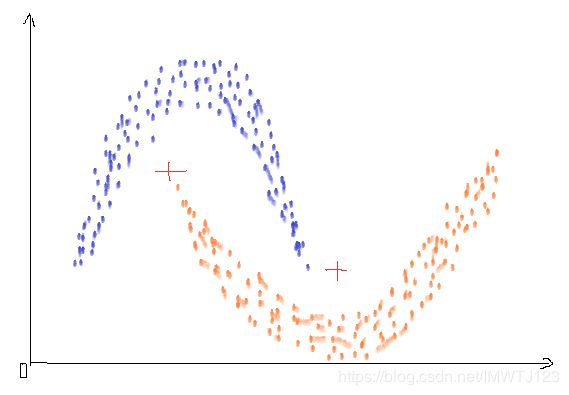
K-Means 算法、K-Means++ 算法和Mean Shift 算法都是基于距离的聚类算法,当数据集中的聚类结果是球状结构时,能够得到比较好的结果,但当数据集中的聚类结果是非球状的结构时,基于距离的聚类算法的聚类效果并不好。球状结构的聚类如我们前面讲的,非球类结构的聚类如下图所示:
基于距离的三种聚类算法其解得的聚类结果都不对,在上图中,数据的分布呈现明显的密度趋势,所以基于密度的聚类算法 DBSCAN 被提出。
二、DBSCAN 算法原理
1.基本概念
DBSCAN 是一种典型的基于密度的聚类算法,它有两个最基本的邻域参数——![]() 邻域、MinPts:
邻域、MinPts:
 邻域:在数据集 D 中与样本点 xi 的距离不大于
  的样本,即
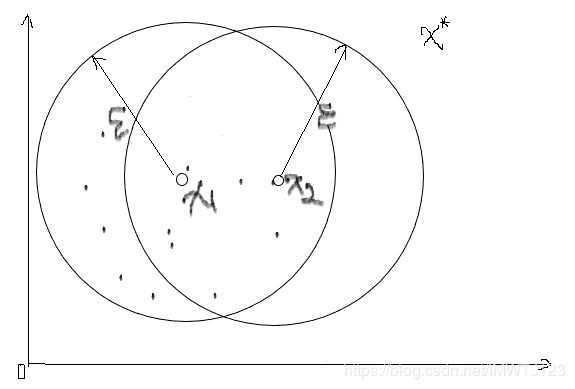
的样本,即 ,如下图所示,x* 不在样本点xi 的
 邻域内,xi 的密度可由 xi 的
 邻域内的点数来估计。
- MinPts:在样本xi的
 邻域内的最少样本点的数目
基于邻域参数![]() 邻域和MinPts,在DBSCAN算法中将数据点分为以下三类:
邻域和MinPts,在DBSCAN算法中将数据点分为以下三类:
- 核心点:半径
 内含有超过MinPts数目的点;
 - 边界点:在半径
 内点的数量小于MinPts,但是落在核心点的邻域内;
 - 噪音点:既不是核心点也不是边界点的点。
在上图中,设置MinPts的值为10,对应的x1的![]() 邻域中有11个样本点,大于MinPts,则x1为核心点。x2的
邻域中有11个样本点,大于MinPts,则x1为核心点。x2的![]() 邻域中有6个样本点,小于MinPts且在x1的
邻域中有6个样本点,小于MinPts且在x1的![]() 邻域内,则x2为边界点,x*为噪声点。
邻域内,则x2为边界点,x*为噪声点。
还定义如下的一些概念:
直接密度可达:给定一个对象集合D,如果p在q的![]() 邻域内,而q是一个核心对象,则称对象p从对象q出发时是直接密度可达的;
邻域内,而q是一个核心对象,则称对象p从对象q出发时是直接密度可达的;
密度可达:如果存在一个对象链 p1, …,pi,.., pn,满足p1 = p 和pn = q,pi是从pi+1关于![]() 和MinPts直接密度可达的,则对象p是从对象q关于
和MinPts直接密度可达的,则对象p是从对象q关于![]() 和MinPts密度可达的;
和MinPts密度可达的;
密度相连:如果存在对象O∈D,使对象p和q都是从O关于![]() 和MinPts密度可达的,那么对象p到q是关于
和MinPts密度可达的,那么对象p到q是关于![]() 和MinPts密度相连的。
和MinPts密度相连的。
如下图所示,设MinPts=3
“直接密度可达”和“密度可达”概念描述:根据前文基本概念的描述,由于有标记的各点M、P、O和R的Eps近邻均包含3个以上的点,因此它们都是核对象;M是从P“直接密度可达”;而Q则是从M“直接密度可达”;基于上述结果,Q是从P“密度可达”;但P从Q无法“密度可达”(非对称)。类似地,S和R从O是“密度可达”的;O、R和S均是“密度相连”(对称)的。
2.DBSCAN算法原理
基于密度的聚类算法通过寻找被低密度区域分离的高密度区域,并将高密度区域作为一个聚类“簇”,在DBSCAN算法中,聚类:簇“定义为:由密度可达关系导出最大的密度连接样本的集合。
若 x 为核心对象,由 x 密度可达的所有样本组成的集合记为:
X={x'![]() D|x'由x密度可达}
D|x'由x密度可达}
则X满足连接性和最大性的簇。
3.DBSCAN算法流程
- 根据给定的邻域参数
 和MinPts确定所有的核心对象
 - 对每一个核心对象
- 选择一个未处理过的核心对象,找到其密度可达的样本生成聚类“簇”
- 重复以上过程
三、 DBSCAN算法实现
# -*- coding: utf-8 -*-
"""
Created on Wed Apr  3 10:41:02 2019

@author: 2018061801
"""
import matplotlib.pyplot as plt
import numpy as np
import math
MinPts = 6  # 定义半径内的最少的数据点的个数
def load_data(file_path):
    '''导入数据
    input:  file_path(string):文件名
    output: data(mat):数据
    '''
    f = open(file_path)
    data = []
    for line in f.readlines():
        data_tmp = []
        lines = line.strip().split("\t")
        for x in lines:
            data_tmp.append(float(x.strip()))
        data.append(data_tmp)
    f.close()
    return np.mat(data)

def epsilon(data, MinPts):
    '''计算半径
    input:  data(mat):训练数据
            MinPts(int):半径内的数据点的个数
    output: eps(float):半径
    '''
    m, n = np.shape(data)
    xMax = np.max(data, 0)
    xMin = np.min(data, 0)
    eps = ((np.prod(xMax - xMin) * MinPts * math.gamma(0.5 * n + 1)) / (m * math.sqrt(math.pi ** n))) ** (1.0 / n)
    return eps

def distance(data):
    m, n = np.shape(data)
    dis = np.mat(np.zeros((m, m)))
    for i in range(m):
        for j in range(i, m):
            # 计算i和j之间的欧式距离
            tmp = 0
            for k in range(n):
                tmp += (data[i, k] - data[j, k]) * (data[i, k] - data[j, k])
            dis[i, j] = np.sqrt(tmp)
            dis[j, i] = dis[i, j]
    return dis

def find_eps(distance_D, eps):
    ind = []
    n = np.shape(distance_D)[1]
    for j in range(n):
        if distance_D[0, j] <= eps:
            ind.append(j)
    return ind

def dbscan(data, eps, MinPts):
    m = np.shape(data)[0]
    # 区分核心点1,边界点0和噪音点-1
    types = np.mat(np.zeros((1, m)))
    sub_class = np.mat(np.zeros((1, m)))
    # 用于判断该点是否处理过,0表示未处理过
    dealed = np.mat(np.zeros((m, 1)))
    # 计算每个数据点之间的距离
    dis = distance(data)
    # 用于标记类别
    number = 1

    # 对每一个点进行处理
    for i in range(m):
        # 找到未处理的点
        if dealed[i, 0] == 0:
            # 找到第i个点到其他所有点的距离
            D = dis[i, ]
            # 找到半径eps内的所有点
            ind = find_eps(D, eps)
            # 区分点的类型
            # 边界点
            if len(ind) > 1 and len(ind) < MinPts + 1:
                types[0, i] = 0
                sub_class[0, i] = 0
            # 噪音点
            if len(ind) == 1:
                types[0, i] = -1
                sub_class[0, i] = -1
                dealed[i, 0] = 1
            # 核心点
            if len(ind) >= MinPts + 1:
                types[0, i] = 1
                for x in ind:
                    sub_class[0, x] = number
                # 判断核心点是否密度可达
                while len(ind) > 0:
                    dealed[ind[0], 0] = 1
                    D = dis[ind[0], ]
                    tmp = ind[0]
                    del ind[0]
                    ind_1 = find_eps(D, eps)

                    if len(ind_1) > 1:  # 处理非噪音点
                        for x1 in ind_1:
                            sub_class[0, x1] = number
                        if len(ind_1) >= MinPts + 1:
                            types[0, tmp] = 1
                        else:
                            types[0, tmp] = 0

                        for j in range(len(ind_1)):
                            if dealed[ind_1[j], 0] == 0:
                                dealed[ind_1[j], 0] = 1
                                ind.append(ind_1[j])
                                sub_class[0, ind_1[j]] = number
                number += 1

    # 最后处理所有未分类的点为噪音点
    ind_2 = ((sub_class == 0).nonzero())[1]
    for x in ind_2:
        sub_class[0, x] = -1
        types[0, x] = -1

    return types, sub_class

def save_result(file_name, source):
    f = open(file_name, "w")
    n = np.shape(source)[1]
    tmp = []
    for i in range(n):
        tmp.append(str(source[0, i]))
    f.write("\n".join(tmp))
    f.close()

if __name__ == "__main__":
    # 1、导入数据
    print ("----------- 1、load data ----------")
    data = load_data("D:/anaconda4.3/spyder_work/data6.txt")
    # 2、计算半径
    print ("----------- 2、calculate eps ----------")
    eps = epsilon(data, MinPts)
    # 3、利用DBSCAN算法进行训练
    print ("----------- 3、DBSCAN -----------")
    types, sub_class = dbscan(data, eps, MinPts)
    # 4、保存最终的结果
    print ("----------- 4、save result -----------")
    save_result("types", types)
    save_result("sub_class", sub_class)


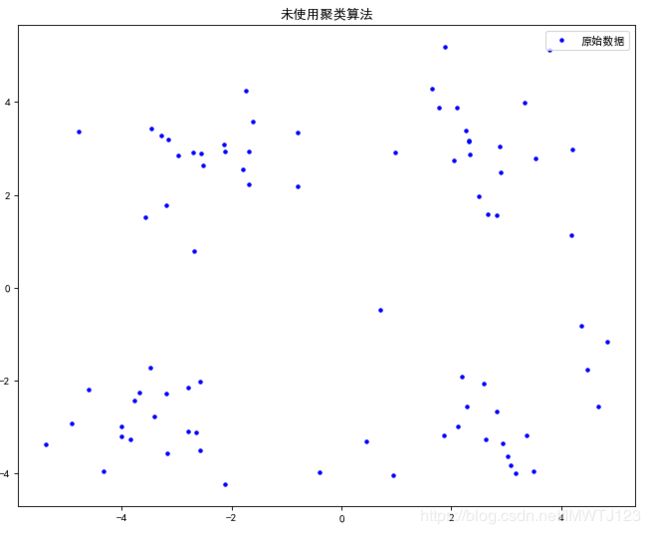
"""未使用聚类算法"""
f = open("D:/anaconda4.3/spyder_work/data6.txt")
x = []
y = []
for line in f.readlines():
    lines = line.strip().split("\t")
    if len(lines) == 2:
        x.append(float(lines[0]))
        y.append(float(lines[1]))
f.close()
#显示中文标题
plt.rcParams['font.sans-serif']=['SimHei']
plt.rcParams['axes.unicode_minus'] = False
plt.figure(figsize=(10,8), dpi=80)
plt.plot(x, y, 'b.', label="原始数据")
plt.title('未使用聚类算法')
plt.legend(loc="upper right")
plt.show()


"""打开两个保存的文件"""
f = open("D:/anaconda4.3/spyder_work/sub_class.txt")
center_x = []
center_y = []
for line in f.readlines():
    lines = line.strip().split("\t")
    if len(lines) == 2:
        center_x.append(lines[0])
        center_y.append(lines[1])
f.close()

f = open("D:/anaconda4.3/spyder_work/types.txt")
types = []
for line in f.readlines():
    lines = line.strip().split("\t")
    if len(lines) == 1:
        types.append(float(lines[0]))
f.close()


"""使用聚类算法"""
data1=load_data("D:/anaconda4.3/spyder_work/sub_class.txt")
data1=np.array(data1)
N = len(data1)
#核心点
core_x_0=[]
core_y_0=[]
core_x_1=[]
core_y_1=[]
core_x_2=[]
core_y_2=[]
core_x_3=[]
core_y_3=[]
#边界点
boundary_x_0=[]
boundary_y_0=[]
boundary_x_1=[]
boundary_y_1=[]
boundary_x_2=[]
boundary_y_2=[]
boundary_x_3=[]
boundary_y_3=[]
#噪音点
noise_x=[]
noise_y=[]
for i in range(N):
    if data1[i]==-1:
        noise_x.append(data[i,0])
        noise_y.append(data[i,1])
    elif data1[i]==1:
        if types[i]==1:
            core_x_0.append(data[i,0])
            core_y_0.append(data[i,1])
        else:
            boundary_x_0.append(data[i,0])
            boundary_y_0.append(data[i,1])
    elif data1[i]==2:
        if types[i]==1:
            core_x_1.append(data[i,0])
            core_y_1.append(data[i,1])
        else:
             boundary_x_1.append(data[i,0])
             boundary_y_1.append(data[i,1])
    elif data1[i]==3:
        if types[i]==1:
            core_x_2.append(data[i,0])
            core_y_2.append(data[i,1])
        else:
             boundary_x_2.append(data[i,0])
             boundary_y_2.append(data[i,1])
    elif data1[i]==4:
        if types[i]==1:
            core_x_3.append(data[i,0])
            core_y_3.append(data[i,1])
        else:
             boundary_x_3.append(data[i,0])
             boundary_y_3.append(data[i,1])

plt.figure(figsize=(10,8), dpi=80)
plt.plot(core_x_0, core_y_0,'b+',label="core_0")
plt.plot(core_x_1, core_y_1,'k+',label="core_1")
plt.plot(core_x_2, core_y_2,'g+',label="core_2")
plt.plot(core_x_3, core_y_3,'c+',label="core_3")
plt.plot(boundary_x_0,boundary_y_0,'b.',label="boundary_0")
plt.plot(boundary_x_1,boundary_y_1,'k.',label="boundary_1")
plt.plot(boundary_x_2,boundary_y_2,'g.',label="boundary_2")
plt.plot(boundary_x_3,boundary_y_3,'c.',label="boundary_3")
plt.plot(noise_x,noise_y,'*r',label="noise")
plt.title('使用聚类算法')
plt.legend(loc="best")
plt.show()
结果:
----------- 1、load data ----------
----------- 2、calculate eps ----------
----------- 3、DBSCAN -----------
----------- 4、save result -----------
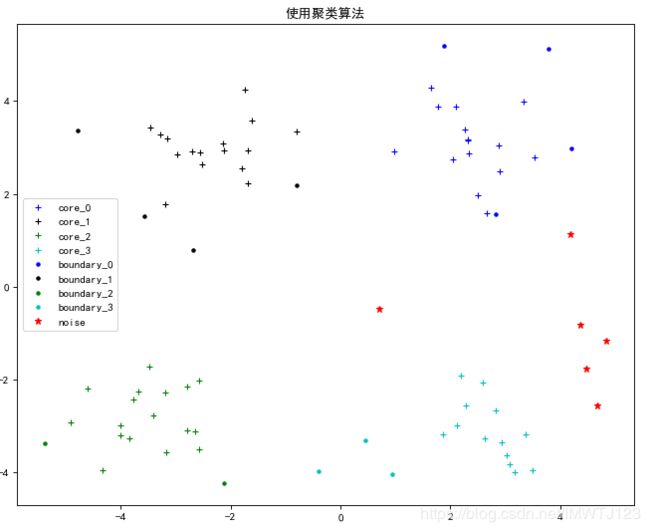
上图中,十字代表的核心点,圆点代表的是边界点,红色的星代表的是噪音点,不同的颜色代表着不同的类。
另外,在DBSCAN算法中,其聚类结果和![]() 的取值有关,若
的取值有关,若![]() 取值太小,则聚类结果中噪音点数量变多,持续减少
取值太小,则聚类结果中噪音点数量变多,持续减少![]() 的值,最终导致所有的样本被划分为噪音点;如果
的值,最终导致所有的样本被划分为噪音点;如果![]() 取值过大,聚类结果中噪音点减少,持续增大
取值过大,聚类结果中噪音点减少,持续增大![]() 的值,类的数量将减少,所以为得到正确有效的聚类结果,需要设置合适的
的值,类的数量将减少,所以为得到正确有效的聚类结果,需要设置合适的![]() 值。
值。
数据链接
参考文献
1.DBSCAN基本原理
2.赵志勇——Python 机器学习算法


