算法学习(一):DBSCAN聚类算法
由于学习需要,最近专门了解了DBSCAN聚类算法,将学习的记录写下来,备用。
一、DBSCAN算法简介
DBSCAN(Density-Based Spatial Clustering of Applications with Noise,具有噪声的基于密度的聚类方法)是一种基于密度的空间聚类算法。
该算法将具有足够密度的区域划分为簇,并在具有“噪声”的空间数据库中发现任意形状的簇,它将簇定义为密度相连的点的最大集合。
对DBSCAN的基本概念的初步认识:
1. 对于簇中的任意一个点,它周围局部点密度必须超过某个阈值;
2. 簇中的点在空间上是相互关联的。
二、DBSCAN算法的5个基本定义
任意点p的局部点密度由两个参数定义,即Eps(邻域的最大半径)及MinPts(在Eps邻域中的最少点数)。相关一些概念的定义如下:
定义1(Eps邻域)
给定一个对象p,p的Eps邻域NEps(p)定义为以p为核心,以Eps为半径的d维超球体区域,即:

其中,D为d维实空间上的数据集, dist (p,q)表示D中的2个对象p和q之间的距离。
定义2(核心点与边界点)
对于对象p∈D,给定一个整数MinPts,如果p的Eps邻域内的对象数满足|NEps(p)|≥MinPts ,则称p为(Eps,MinPts ) 条件下的核心点;不是核心点但落在某个核心点的Eps邻域内的对象称为边界点。
定义3(直接密度可达)
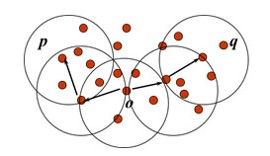
如图所示,给定 (Eps,MinPts ) ,如果对象p和q同时满足如下条件
① p∈ NEps(q) ;
② |NEps(q)|≥MinPts (即q是核心点)。
则称对象p是从对象q出发,直接密度可达的。
定义4(密度可达)
如图所示,给定数据集D,当存在一个对象链 p1,p2,p3,…,pn, 其中 p1 = q , pN= p,对于 pi ∈D ,如果在条件(Eps,MinPts ) 下 pi+1从pi 直接密度可达,则称对象p从对象q在条件 (Eps,MinPts )下密度可达。密度可达是非对称的,即p从q密度可达不能推出q也从p密度可达。

定义5(密度相连)
如图所示,如果数据集D中存在一个对象o,使得对象p和q是从o在 (Eps,MinPts )条件下密度可达的,那么称对象p和q在 (Eps,MinPts )条件下密度相连。密度相连是对称的。
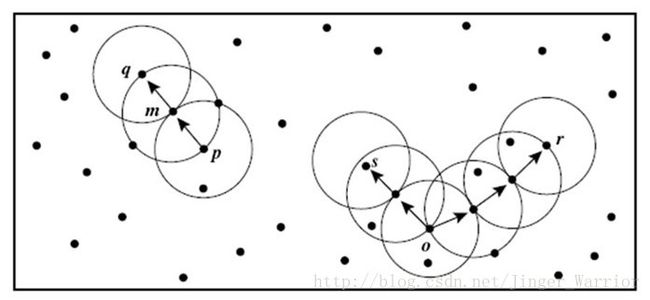
关于密度可达和密度相连,示例如图,给定圆的半径Eps,MinPts=3。
在被标记的点中,m,p,o和r都是核心点,因为它们的Eps邻域内都至少包含3个对象,对象q是从m直接密度可达的。对象m是从p直接密度可达的。对象q是从p(间接)密度可达,但p并不是从q密度可达,因为q不是核心点。
类似地,r和s是从o密度可达的;而o是从r密度可达的。因此,o、r和s都是密度相连的。
三、DBSCAN算法流程
输入:
Eps ——半径
MinPts ——给定点在E邻域内成为核心对象的最小邻域点数。
D ——包含n个对象的数据库。
输出:目标类簇集合
方法:
① 任意选取一个没有加簇标签的点p ;
② 得到所有从p关于Eps和MinPts密度可达的点;
③ 如果p是一个核心点,形成一个新的簇,给簇内所有对象点加簇标签;
④ 如果p是一个边界点,没有从p密度可达的点,DBSCAN将访问数据库中的下一个点;
⑤ 继续这一过程,直到数据库中的所有点都被处理。
四、DBSCAN算法的优缺点
优点:
1) 形成的簇可以具有任意形状和大小;
2) 可以自动确定形成的簇数目;
3) 可以分离簇和环境噪声;
4) 可以被空间索引结构所支持;
5) 效率高,即使对大数据集也是如此;
6) 一次扫描数据即可完成聚类。
缺点:
1) 只能发现密度相仿的簇;
2) 对用户定义的参数(Eps和MinPts)是敏感的,参数难以确定(特别是对于高维数据),设置的细微不同可能导致差别很大的聚类;
3) 所使用参数Eps和MinPts是两个全局参数,不能刻画高维数据内在的聚类结构,因为真实的高维数据常常具有非常倾斜的分布;
4) 计算复杂度至少为 O(n2),若采用空间索引,计算复杂度为 O(nlogn)。
举个例子
这是聚类以后的结果,得到的图形是不规则的,可以是任意的图形,这个结果不是我运行出来的,找不到这个特殊的数据集。

这个结果看起来很复杂,但是也体现了DBSCAN算法的有点,对于任意聚类形状都有良好的效果,关键在于对领域半径Eps和最小点数minPts的选择。

最后这个结果,才是我运行出来的,没有特殊数据集,所以只能用python中的random()产生了一个随机数据集,所以得到的结果并不是很有特点。但也能明显的看出噪声点,以及聚类的结果。

用python编写的DBSCAN聚类算法
# -*- coding: utf-8 -*-
"""
Created on Mon May 01 21:22:45 2017

@author: Administrator
"""

from matplotlib.pyplot import *
from collections import defaultdict
import random

 #计算相邻的数据点的距离
def dist(p1, p2):
    return ((p1[0]-p2[0])**2+ (p1[1]-p2[1])**2)**(0.5)

 #随机生成约100个坐标点
all_points=[]

for i in range(100):
    randCoord = [random.randint(1,50), random.randint(1,50)]
    if not randCoord in all_points:
        all_points.append(randCoord)


#取领域的最大半径Eps = 8, 阈值minPts = 8
E = 8
minPts = 8

#找出核心点
other_points =[]
core_points=[]
plotted_points=[]
for point in all_points:
    point.append(0) # assign initial level 0
    total = 0
    for otherPoint in all_points:
        distance = dist(otherPoint,point)
        if distance<=E:
            total+=1

    if total > minPts:
        core_points.append(point)
        plotted_points.append(point)
    else:
        other_points.append(point)

#找出边界点
border_points=[]
for core in core_points:
    for other in other_points:
        if dist(core,other)<=E:
            border_points.append(other)
            plotted_points.append(other)


#执行算法
cluster_label=0

for point in core_points:
    if point[2]==0:
        cluster_label+=1
        point[2]=cluster_label

    for point2 in plotted_points:
        distance = dist(point2,point)
        if point2[2] ==0 and distance<=E:
            print point, point2
        point2[2] =point[2]


#给点加上簇标签
cluster_list = defaultdict(lambda: [[],[]])
for point in plotted_points:
    cluster_list[point[2]][0].append(point[0])
    cluster_list[point[2]][1].append(point[1])

markers = ['*','+','.','d','^','v','>','<','p']

#画出簇
i=0
print cluster_list
for value in cluster_list:
    cluster= cluster_list[value]
    plot(cluster[0], cluster[1],markers[i])
    i = i%10+1

#画出噪声点
noise_points=[]
for point in all_points:
    if not point in core_points and not point in border_points:
        noise_points.append(point)
noisex=[]
noisey=[]
for point in noise_points:
    noisex.append(point[0])
    noisey.append(point[1])
plot(noisex, noisey, "o")

title(str(len(cluster_list))+" clusters created with E ="+str(E)+" Min Points="+str(minPts)+" total points="+str(len(all_points))+" noise Points = "+ str(len(noise_points)))
axis((0,60,0,60))
show()

