Top mAP and mAP
Top mAP and mAP
预备知识——Precision§ & Recall®
| Relevant | Non Relevant | |
|---|---|---|
| Retrieved | True Positives (tp) | False Positives (fp) |
| Not Retrieved | False Negatives (fn) | True Negatives (tn) |
则:
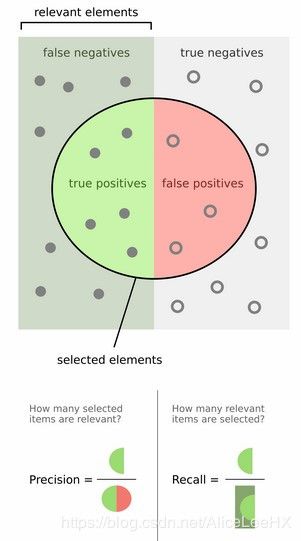
P = t p t p + f p R = t p t p + f n P=\frac{tp}{tp+fp}\\ R=\frac{tp}{tp+fn} P=tp+fptpR=tp+fntp
如下图所示,P和R的定义会更清楚一些:
-
F1 Measurement:
因为 P P P 和 R R R 是此消彼长的关系,在某些情况下,两者是矛盾的,因此为了综合考量两种因素,提出了F1 Measurement,其是Precision和Recall的加权调和平均:
F = ( a 2 + 1 ) P ∗ R a 2 ( P + R ) 当 参 数 a = 1 时 , 就 是 常 见 的 F 1 : F 1 = 2 P R P + R \quad \quad \quad F=\frac{(a^2+1)P*R}{a^2(P+R)}\\ \quad \quad 当参数a=1时,就是常见的F_1:\\ F_1=\frac{2PR}{P+R} F=a2(P+R)(a2+1)P∗R当参数a=1时,就是常见的F1:F1=P+R2PR
F 1 F_1 F1综合考量了 P P P 和 R R R 的结果,当 F 1 F_1 F1的结果比较高时,说明实验方法是比较理想的 -
Average Precision:
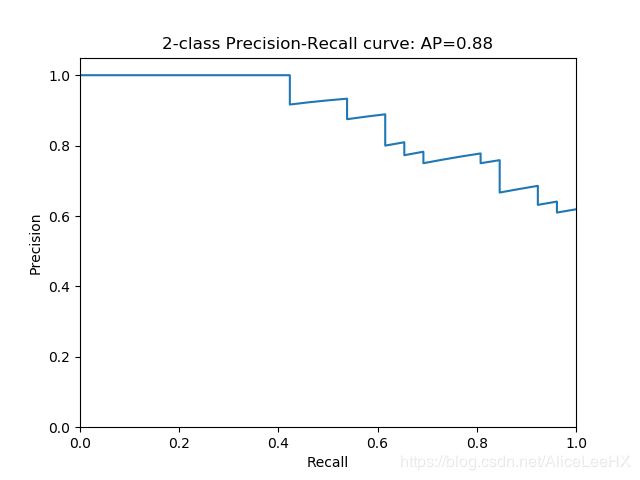
AP是为解决 P , R , F − m e a s u r e P,R,F-measure P,R,F−measure的单点值局限性的。为了得到一个能够反映全局性能的指标,其计算公式如下:
A P = ∫ 0 1 P ( R ) d R AP=\int_{0}^{1}P(R)dR AP=∫01P(R)dR
也即:在准确率-召回率曲线中,曲线与坐标轴之间所形成的面积越大,代表性能越好,同时,在工业界,曲线应当尽可能向上突出 -
mean Average Precision(mAP):
对应于AP,mAP可以看作是AP在数据集上的平均值:
m A P = ∑ q = 1 Q A P ( q ) Q 其 中 Q 是 任 务 的 数 量 mAP=\frac{\sum_{q=1}^{Q}AP(q)}{Q}\\ 其中Q是任务的数量 mAP=Q∑q=1QAP(q)其中Q是任务的数量
Example
Data
首先利用自己已经训练好的模型,得到所有测试样本的Confidence Score,假设共有20个测试样本,每个ID对应的Confidence Score 和Ground Truth Label如下表所示。
| ID | Score | Label |
|---|---|---|
| 1 | 0.23 | 0 |
| 2 | 0.76 | 1 |
| 3 | 0.01 | 0 |
| 4 | 0.91 | 1 |
| 5 | 0.13 | 0 |
| 6 | 0.45 | 0 |
| 7 | 0.12 | 1 |
| 8 | 0.03 | 0 |
| 9 | 0.38 | 1 |
| 10 | 0.11 | 0 |
| 11 | 0.03 | 0 |
| 12 | 0.09 | 0 |
| 13 | 0.65 | 0 |
| 14 | 0.07 | 0 |
| 15 | 0.12 | 0 |
| 16 | 0.24 | 1 |
| 17 | 0.1 | 0 |
| 18 | 0.23 | 0 |
| 19 | 0.46 | 0 |
| 20 | 0.08 | 1 |
对所有的Confidence Score进行排序,得到:
| ID | Score | Label |
|---|---|---|
| 4 | 0.91 | 1 |
| 2 | 0.76 | 1 |
| 13 | 0.65 | 0 |
| 19 | 0.46 | 0 |
| 6 | 0.45 | 0 |
| 9 | 0.38 | 1 |
| 16 | 0.24 | 1 |
| 1 | 0.23 | 0 |
| 18 | 0.23 | 0 |
| 5 | 0.13 | 0 |
| 7 | 0.12 | 1 |
| 15 | 0.12 | 0 |
| 10 | 0.11 | 0 |
| 17 | 0.1 | 0 |
| 12 | 0.09 | 0 |
| 20 | 0.08 | 1 |
| 14 | 0.07 | 0 |
| 8 | 0.03 | 0 |
| 11 | 0.03 | 0 |
| 3 | 0.01 | 0 |
Top-K mAP
如上表所示,我们根据Confidence的值对数据进行了排序,如果我们想得到Top-K的mAP的值的话,就按照降序原则,提取前K个数据作为样本,而不考虑后续的样本所得到的结果,如我们想得到Top-5的结果,所以其子数据集就是:
| ID | Score | Label |
|---|---|---|
| 4 | 0.91 | 1 |
| 2 | 0.76 | 1 |
| 13 | 0.65 | 0 |
| 19 | 0.46 | 0 |
| 6 | 0.45 | 0 |
在这个例子中,True Positives就是指第4和第2个样本,False Positives就是指第13,19,6个样本
P r e c i s i o n = 2 / 5 = 40 Precision=2/5=40% Precision=2/5=40:对于某一二分类问题,我们选定了5个样本,其中正确的有2个,即准确率为40%;
R e c a l l = 2 / 6 = 30 Recall=2/6=30% Recall=2/6=30:意思是在Top-K和测试样本中,共有6个样本,但是因为我们只召回了2个,所以召回率为30%
而在实际多类别分类任务中,我们通常不满足只通过top-K来衡量一个模型的好坏,而是需要知道从top-1到top-N(N是所有测试样本个数)对应的precision和recall。而当K取N时,即为mAP。
Demo
此处,我们是随机生成的数据,同时利用欧几里得距离来生成Confidence
import numpy as np
import sklearn
import matplotlib.pyplot as plt
from sklearn.metrics import average_precision_score
from sklearn.metrics import precision_recall_curve

def dist(a,b):
    dists= np.sqrt(np.sum(np.square(a-b)))
    return dists

def compute_distances(Q,E):
    num=E.shape[0]
    connum=E.shape[1]
    dists=[]
    for i in range(num):
        sum=0
        for j in range(connum):
            sum=sum+dist(Q[j],E[i,j])
        dists.append(sum)
    dists=np.array(dists)
    return dists

def topmAP(Q,TX,FX,topk):

    ###     label       ###
    Tnum=TX.shape[0]
    Fnum=FX.shape[0]
    Ta=np.ones((Tnum))
    Fa=np.zeros((Fnum))
    y_true=np.hstack((Ta,Fa))

    ###     score       ###
    dTX=compute_distances(Q,TX)
    dFX=compute_distances(Q,FX)
    y_score=np.hstack((dTX,dFX))

    ###     rank        ###
    data=zip(y_true,y_score)
    data=sorted(data,key=lambda l:(l[1],l[0]))
    data_true=[]
    data_score=[]
    con=0
    ###         mAP        ###
    for _,i in enumerate(data):
        if con != topk:
            data_true.append(i[0])
            data_score.append(i[1])
            con=con+1

    data_true=np.array(data_true)
    data_score=np.array(data_score)

    resmAP=average_precision_score(data_true,data_score)

    return resmAP

def mAP(Q,TX,FX):
    tnum=TX.shape[0]
    fnum=FX.shape[0]
    num=tnum+fnum

    resmAP=topmAP(Q,TX,FX,num)

    return resmAP

if __name__ == "__main__":

    a = np.random.randn(10)
    b = np.random.randn(20,10)
    c = np.random.randn(10,10)

    topk=5

    topmap=topmAP(a,b,c,topk=topk)

    mapall=mAP(a,b,c)

    print('The Value of the Top-%d mAP is %f '%(topk,topmap))
    print('The Value of the mAP is %f '%(mapall))
- Result:
The Value of the Top-5 mAP is 0.700000
The Value of the mAP is 0.558517
显然随着我们选定的样本越来也多,recall一定会越来越高,而precision整体上会呈下降趋势。把recall当成横坐标,precision当成纵坐标,即可得到常用的precision-recall曲线。

